




Analysis system for transformer oil gas test results (DGA) with email alerts, for power transformer care in factories
Customer: A large manufacturing group in Thailand
The transformer analysis system in this case is a web app that imports test results for gases dissolved in transformer oil (DGA), then displays charts, Normal / Warning / Alarm status and a recommendation for the next oil sampling interval, and sends email alerts when results are abnormal. We developed this system in 2018–2019, installed it on a server in the customer's closed network and delivered all items in 2019.
- Industry
- Energy
- Year
- 2018–2019
- Scope of work
- Requirements gathering, design and development of a DGA analysis web app (test result import, 3 types of triangle chart, a bar chart of 6 key gases, trend charts, Condition / TDCG Rate criteria tables, email alerts and PDF reports); installation on the customer's server in a closed network; acceptance testing and fixes based on the acceptance results; preparation of system design documents and user manuals.
Summary
- This case is a web app that imports transformer oil gas test results (DGA) from Excel files or on-screen entry, and keeps the test result history of each transformer in a Microsoft SQL Server database.
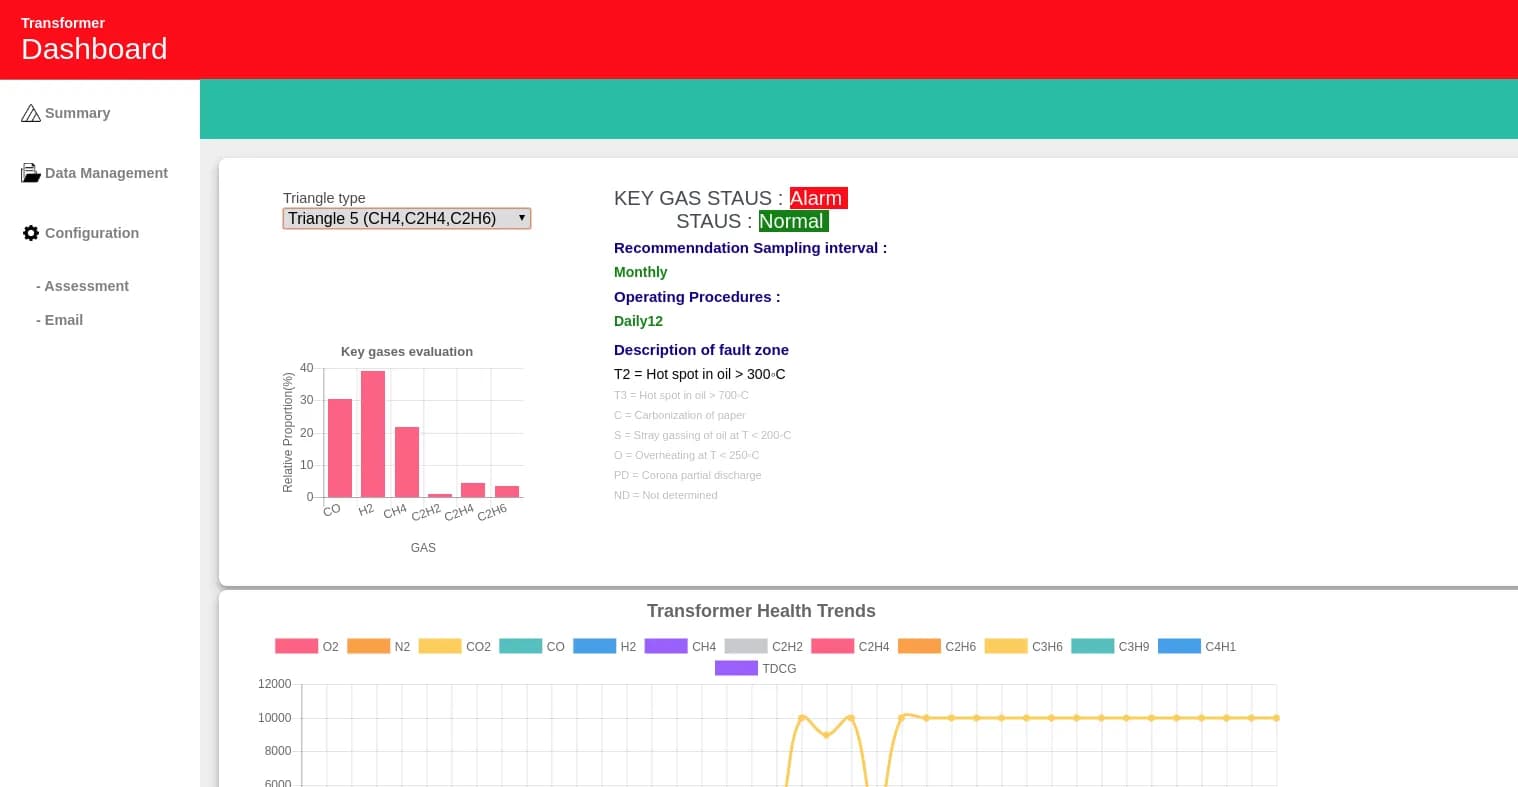
- The system offers a choice of 3 triangle charts with descriptions of the abnormality zones, a bar chart of the proportions of 6 key gases, and a line chart of gas value trends by date.
- Normal / Warning / Alarm status and sampling interval recommendations come from the Condition and TDCG Rate criteria tables, which can be edited in the system. Maintenance decisions still rest with the transformer care team.
- The system sends an email immediately when the status is Warning or Alarm, and runs entirely on the customer's server in a closed network with no internet connection.
- Acceptance testing in April 2019 found points that needed fixing, such as the triangle chart scale. We made the fixes and retested, then delivered all items in 2019.
The on-site brief
The customer used a separate Excel report for each transformer for test results on gases dissolved in transformer oil (DGA: Dissolved Gas Analysis). The customer wanted a web app that brought charting, status indication and sampling interval recommendations into a single system, sent an email when results were abnormal, and worked on a closed network with no internet connection.
What we did
We developed a web app with PHP and Microsoft SQL Server on the customer's server. The system takes DGA results from Excel files or on-screen entry, displays 3 types of triangle chart, a bar chart of 6 key gases and trend charts, then compares values with criteria tables that can be edited in the system to indicate the status and the next sampling interval, and sends email alerts when the status is Warning or Alarm.
- DGA test resultsExcel file or on-screen entry
- PHP web application+ Microsoft SQL Server
- Triangle charts, bar charts, trend chartsCompared with the Condition / TDCG Rate criteria table
- Normal / Warning / Alarm status+ sampling interval recommendations
- Email alerts+ PDF reports
Results
Acceptance testing in April 2019 found points that needed fixing, such as the scale of the triangle chart image not matching the original. We made the fixes and retested, then delivered all items in 2019, together with system design documents and user manuals.
How the brief came about
The task in this case was to move the reading of transformer oil gas test results (DGA) from a separate Excel report for each transformer into a single web app. The customer's existing reports contained historical test result tables, triangle charts, trend charts, status and recommendations for the next oil sampling interval.
In transformer care generally, abnormalities inside a transformer cannot be seen from the outside, so oil test results are the main information used for maintenance decisions. When each transformer's test results sit in a separate file, getting an overview of all the transformers is difficult.
What is DGA (Dissolved Gas Analysis)?
DGA is the testing of gases dissolved in a transformer's insulating oil. When abnormally high heat or electrical discharge occurs inside a transformer, the oil and insulation break down and produce different types of gas. The proportions of the gases therefore indicate what type of abnormality is likely, and values that rise over time indicate whether closer monitoring is advisable.
Requirements and constraints
The system had to do what the existing Excel reports could do, and had to sit entirely within the customer's network. The main requirements were as follows.
- Accept test results both by Excel file upload and by entering, adding, deleting and editing values on screen
- Display triangle charts, bar charts and trend charts with descriptions of the abnormality zones, in the same form the team reads in the existing reports
- Assess status and sampling interval from Condition and TDCG Rate criteria tables that users can edit
- Send email alerts when test results are abnormal
- Run on the customer's server in a closed network with no internet connection
- The customer specified PHP and a Microsoft SQL Server database
Why this system is a web app on the customer's server
This system is a web app on the customer's server because the customer required a web app installed on the customer's server in a closed network, using PHP and Microsoft SQL Server. Every test result is therefore stored in a database within the organisation. Users open the system through a web browser from a machine on the internal network and access it with a user account.
All users see status calculated from the same set of criteria tables in the system, and email alerts go to the configured recipients without waiting for anyone to open a file.
How the system assesses transformer status from DGA results
The system assesses status by comparing gas values with the Condition and TDCG Rate criteria tables, which can be edited in the system, then displays Normal / Warning / Alarm status with sampling interval recommendations and action steps. The system only displays results, makes recommendations and sends emails. Decisions on sampling or maintenance still rest with the transformer care team. The workflow is as follows.
- 1
Import oil gas test results
Upload test reports from Excel files, or enter, add, delete and edit values on screen. The report header details for each transformer can be edited on both the add-data page and the report page.
- 2
Calculate gas proportions and draw charts
The system calculates the proportion of each gas, then plots a point on a triangle chart with a choice of 3 types, with text stating which abnormality zone the point falls in. The system displays a bar chart of the proportions of 6 key gases and a line chart of gas value trends by date, in which each gas can be shown or hidden individually.
- 3
Assess status against the criteria tables
The system compares gas values with the criteria table (Condition). If a result exceeds the normal criteria, the system compares the total combustible gas value (TDCG: Total Dissolved Combustible Gas) and its rate of increase (TDCG Rate) with another table, to display the status, a recommendation for the next sampling interval and the action steps.
- 4
Send alerts and produce reports
When the status is Warning or Alarm, the system sends an email immediately, and sends each recipient a summary email listing items according to the selected data types. Users can produce reports as PDF files from the report page.
Deliverables
We delivered a DGA analysis web app installed on the customer's server, together with system design documents and user manuals. In addition to the test result import page and report page in the steps above, the system has the following sections for administrators.
- Criteria settings page: edit the Condition criteria table and the TDCG Rate table; changes must be saved each time
- Email page: add recipients, turn sending on or off, and choose whether each recipient receives Normal, Warning or Alarm status items
- Access: log in with a user account through a web browser on the internal network
Confirmed results from acceptance testing and delivery
We delivered all items of the DGA analysis web app, with 3 types of triangle chart and a bar chart of 6 key gases, in 2019. Acceptance testing in April 2019 found that the scale of the triangle chart image did not match the original, and that when gas values were entered incompletely, the point on the chart fell outside the triangle, so users asked for points outside the chart to be hidden. We fixed both issues and retested before delivery.
- 2018: project planning and requirements gathering began
- April 2019: system acceptance testing, and recording of items that needed fixing
- 2019: fixes, retesting and delivery of all items, together with system design documents and user manuals
This case has no measured business figures and no post-delivery usage report, so we report only the results backed by documents.
What we learned
This work offers 3 principles for systems that read test results and raise alerts against criteria.
- Test with incomplete data before acceptance testing. Real test results may be missing some values, so test data sets should include both complete and missing values, and how the system must display results when data is incomplete should be defined in advance.
- The charts a team uses to read results must match the originals the team is familiar with. Use original chart images with the correct scale, and confirm the screen designs with users before development starts.
- Criteria and alert recipients should be information the team that owns the work can edit itself. In this work, the criteria tables can be edited on the settings page and must be saved each time, while email recipients can be added and data types chosen per person.
How you can apply this approach to your transformer care work
If you have several transformers and already send oil for DGA testing at regular intervals, you can use the same approach as this case: bring test results into one database, compare them with the criteria tables your team uses, and send alerts by email. The parts that need adapting are the test result file format, the criteria your organisation uses and the IT systems that must be connected.
Reusable parts and parts that need adapting
| System part | Reusable | Needs adapting when |
|---|---|---|
| Test result import | Excel file upload and on-screen entry | The laboratory sends results in a different format, and a fixed format must be agreed first |
| Charts and result reading | Triangle charts, bar charts and trend charts | Your team uses charts or zone descriptions that differ from this case, and new screen designs must be confirmed |
| Status assessment | Comparison with editable Condition and TDCG Rate criteria tables | Your organisation uses a different set of reference criteria, and the criteria tables and the people authorised to edit them must be prepared |
| Alerts and reports | Email alerts on Warning or Alarm, and PDF reports | An internal email server must be used, or a different report format is needed |
| Installation and access | Web app on a server in a closed network | Connection to the organisation's central login system, or tiered user permissions, is needed |
- Prepare sample test reports from the laboratory, both with complete values and with missing values
- Identify the criteria tables your organisation uses as a reference, and who is authorised to edit the criteria
- Check whether you have a server, a database and an internal email server for a system that runs on a closed network
- Agree clearly who receives email alerts and who decides the next step when the status is Warning or Alarm
Read more
- Custom system development service
- Annual system care and maintenance service
- InCBM: machine condition monitoring system
- Case: thermal image decoding and stitching module for electrical control cabinets
- Case: tablet app for monitoring machine vibration (InCBM)
- Article: On-Premise or Cloud: where should factory data be kept?
Technology used
Frequently Asked Questions
Does this system measure gas values from the transformer itself?
No. The system receives dissolved gas analysis (DGA) results obtained by sending oil samples for testing. The results are imported from an Excel file or entered on screen, after which the system calculates values, plots graphs, assesses status and sends alerts.
Can it be used on a network with no internet connection?
Yes. The system in this case study is installed on the customer's server, uses a Microsoft SQL Server database and runs on a closed network with no internet connection. Users open it in a web browser from computers within the organisation.
Can we adjust the status assessment criteria ourselves?
Yes. The Condition criteria table and the TDCG Rate table can be edited on the system's settings page, and each edit must be saved by pressing save.
Does the system order maintenance work or shut down the transformer by itself?
No. The system displays the status, sampling interval recommendations and operating procedures according to the criteria tables, then sends an email alert when the status is Warning or Alarm. Maintenance decisions rest with the team responsible for the transformers.
What are the price and development time?
There is no fixed price. It depends on the number of transformers, the format of the test reports, the criteria used and integration with the organisation's existing systems. Please contact us to request a quotation.