




Vibration Monitoring Tablet App (InCBM) for Food and Beverage Plants
Customer: International Industrial Technology Company
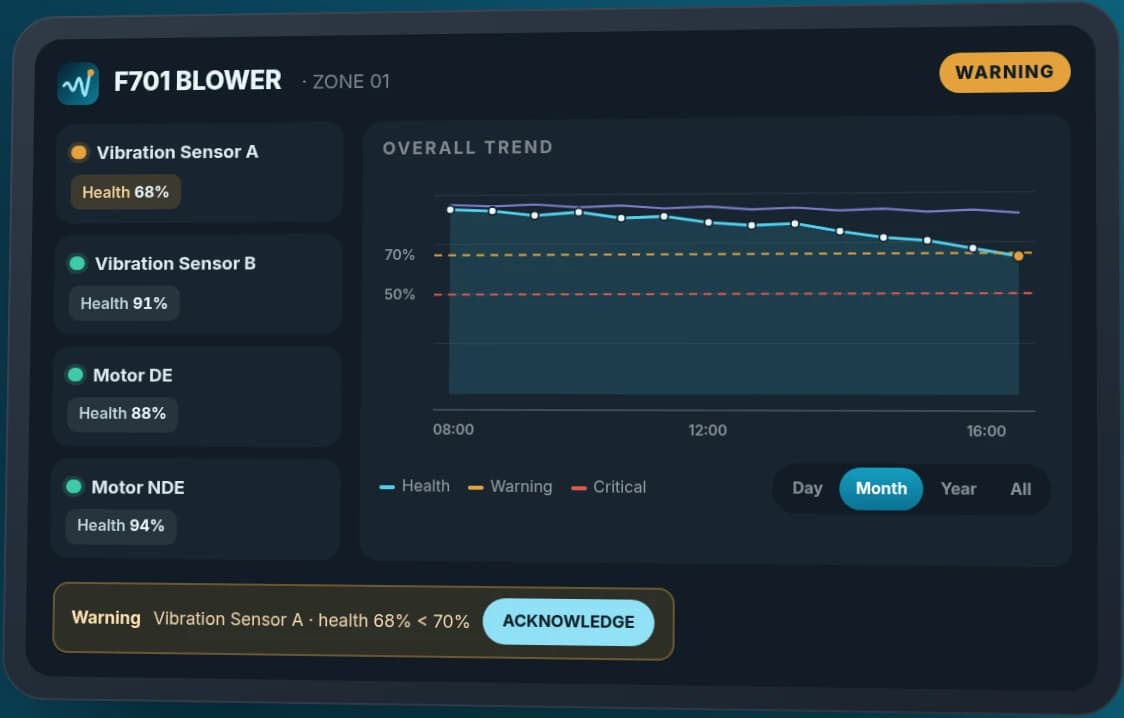
This tablet app brings vibration readings from motors, pumps, and blowers in a food and beverage factory onto a single screen, with a factory layout, status colors, trend charts, and alert history. We extended InCBM to read 76 Tags from 3 vibration monitoring boxes and readings from another 5 machines through a Gateway. The app is installed on 2 factory tablets, with client acceptance testing in progress
- Machine vibration sensorVelocity + impact wave value
- 3 sets of vibration measurement box+ Gateway for 5 machines
- Internal factory serverPython FastAPI + PostgreSQL
- InCBM app on tabletFactory layout, graphs, alerts
- Industry
- FMCG
- Year
- 2025–2026
- Scope of work
- Software work: developing a Data Pipeline (a data transfer system) that reads 76 Tags from 3 measurement boxes, connecting the dashboard to the measurement boxes, adapting the InCBM app for machine monitoring, adding 5 machines that send values through a Gateway, installing the app on 2 of the factory's tablets and preparing the user manual. Sensors and measurement boxes are excluded, as the client supplies them.
- Duration
- July 2025 – September 2026
Summary
- This app brings together the vibration values of motors, pumps and blowers in a food and beverage factory on a tablet. We developed it by building on InCBM.
- The system reads 76 Tags (data points) from 3 vibration measurement boxes, plus values from another 5 machines sent through a Gateway.
- The app shows a factory layout divided into zones, Normal / Watch / Critical status colours, trend graphs, per-sensor alert thresholds and alert history with an acknowledge button.
- The measurement box has no API (an interface between programs) for receiving thresholds from the app, so thresholds set in the app are used only within the app.
- We have installed the app on 2 of the factory's tablets and delivered the manual. The client's acceptance of the work is currently in progress.
The on-site brief
The factory had already installed 3 vibration measurement boxes on its motors, pumps and blowers, but the vibration values sat separately in each box. The on-site team wanted to see the status of every machine on one screen and look back at trends, so as to catch abnormalities at an early stage.
What we did
We developed a tablet app that builds on InCBM (machine condition monitoring system), with a Python FastAPI back end and a PostgreSQL database on a server inside the factory. The system reads 76 Tags (data points) from 3 measurement boxes, plus values from another 5 machines sent through a Gateway (a device that collects sensor signals). The app shows a factory layout, status colours, trend graphs, per-sensor alert thresholds and alert history.
Current status
We installed the app on 2 of the factory's tablets, delivered the user manual and notified the client that the work was complete in September 2026. The client's acceptance of the work is currently in progress.
Measured results
- Data points (tags) read from the measurement box
- 76
- Tablets with the app installed for the factory
- 2
How the brief came about
The challenge in this case was to see the vibration status of every motor, pump and blower on one screen. This food and beverage factory had already installed 3 vibration measurement boxes, but the measured values sat separately in each box. The on-site team therefore wanted to see which machine was starting to behave abnormally and to look back at trends, so they could plan repairs before a machine suffered serious damage.
The sensors and measurement boxes are equipment supplied by the client. Our work is the software that reads values from that equipment, stores them in a database and displays them on tablets the on-site team can carry around.
How do Velocity and the impact wave value differ?
Velocity is the speed of the vibration, in mm/s. The impact wave value is a measuring method from the manufacturer of the measurement box, in g. Both values should be read together with the instrument manual and the thresholds set by the maintenance team.
Requirements and constraints
The system had to work with the measuring equipment the factory already had and had to display on tablets. The main requirements and constraints were as follows.
- Read 76 Tags from 3 measurement boxes. Each measuring point has a Velocity value (mm/s) and an impact wave value (g).
- Support another 5 machines that send values through a Gateway, with Velocity split into X, Y and Z axes plus an impact wave value.
- The back end and database run on a server inside the factory.
- The measurement box has no API for receiving thresholds from outside, so thresholds that users set in the app are not sent back to the box.
- The system can retrieve the list of Events (alert events) from the measurement box, but cannot retrieve the analysis text (Analysis) because no API supports it.
Why this work did not require new sensors
New sensors were not needed because the sensors and 3 measurement boxes were already installed at the factory, and the brief was to read values from those boxes and bring them together on one screen. The main work was therefore combining values, not taking new measurements. The system requirements specified InCBM as the base of the app.
The app only displays information and raises alerts. The maintenance team decides which machines to inspect or repair. The system works in the following sequence.
- 1
Sensors measure vibration on the machine
Measuring points are on the blowers, water pumps, rotary unit and conveying screw (Screw Feed), motors and bucket conveyor (Bucket). Each point gives a Velocity value and an impact wave value.
- 2
Reading values from the measurement boxes and Gateway
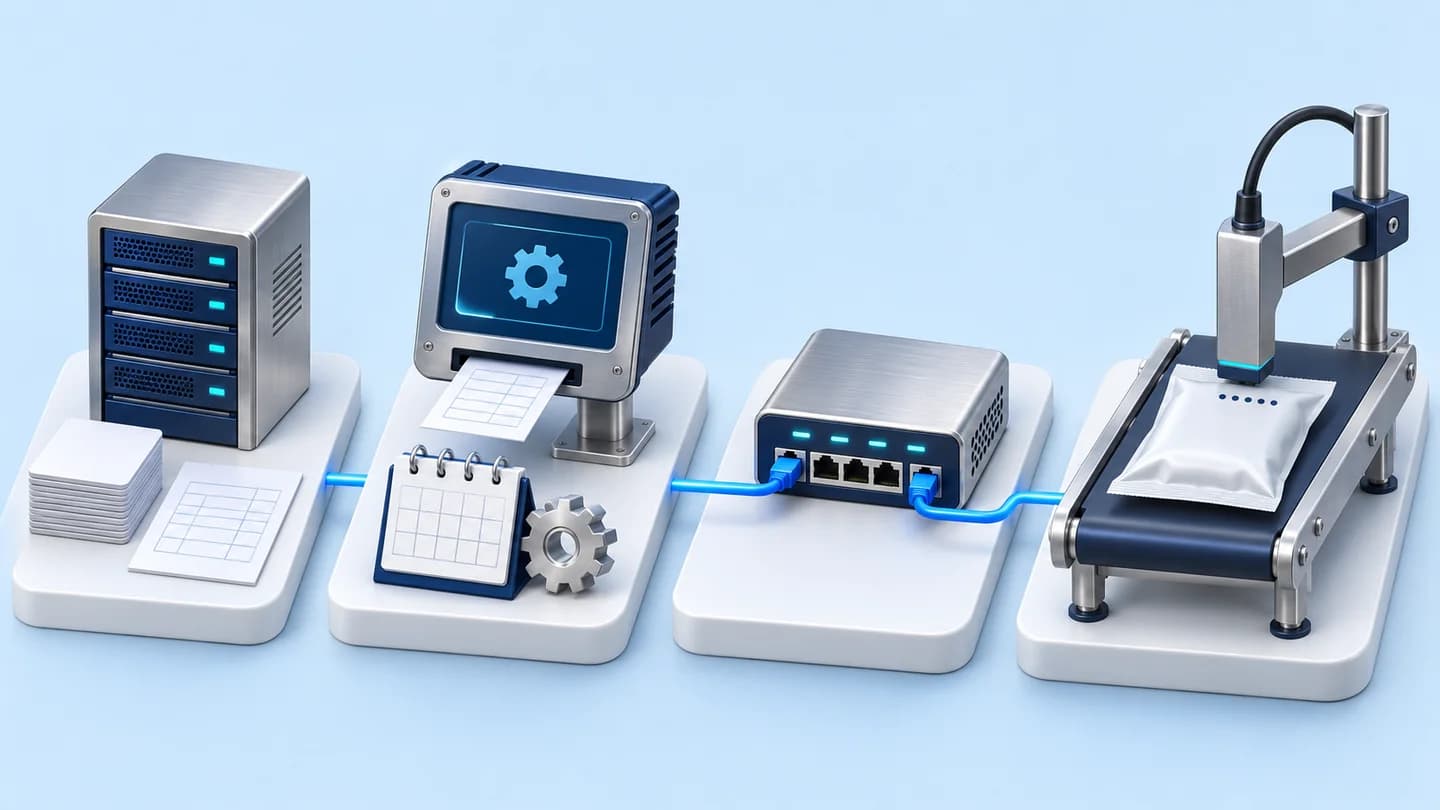
A server inside the factory reads 76 Tags from 3 measurement boxes and reads values from another 5 machines sent through a Gateway.
- 3
Storing the values and comparing them with thresholds
The Python FastAPI back end stores values in a PostgreSQL database, then compares them with each sensor's thresholds to assign a Normal, Watch or Critical status.
- 4
Displaying on the tablet app
The first screen is a factory layout divided into zones, and a zone's frame changes colour when a machine raises an alert. Tapping a zone shows the machine list, photos of the actual machines with their sensor mounting points, and trend graphs whose history can be viewed by day, month or year.
- 5
Setting thresholds and acknowledging alerts
Users can set Watch ranges separately for each sensor and enter their own alert messages. The history screen shows the time, machine and sensor involved. Once a user presses Acknowledge, the item disappears from the main screen.
Deliverables
Our delivery covers the complete software work, from reading values from the equipment through to the tablet app. This work does not include the sensors or measurement boxes.
- Data Pipeline (a data transfer system) that reads 76 Tags from 3 measurement boxes and stores them in a database on a server inside the factory
- Connecting the dashboard to the measurement boxes, including showing the measurement boxes' Event list in the app
- Reading values from 5 machines sent through a Gateway, with thresholds that can be set separately for Velocity on the X, Y and Z axes and for the impact wave value
- InCBM app on tablets: factory layout, status colours, machine photos with sensor mounting points, trend graphs, a threshold-setting screen and alert history
- A note field on the main screen for recording the latest maintenance cycle or repair so that other users can see it
- Installing the app on 2 of the factory's tablets, and the user manual
Steps and scope extension
During the project, the scope was extended to bring another 5 machines that send values through a Gateway into the same app. These machines have Velocity values on 3 separate axes, so a threshold-setting screen had to be added to support the values on each axis. The work sequence was as follows.
- July 2025: project started, reading values from 3 measurement boxes
- During the project: added 5 machines that send values through a Gateway
- September 2026: installed the app on 2 of the factory's tablets, delivered the manual and notified the client that the work was complete
- Current: the client's acceptance of the work is in progress
Confirmed results so far
The results confirmed so far are the installation and the delivery of documents. We installed the vibration monitoring app on 2 of the factory's tablets, delivered the user manual and notified the client that the work was complete in September 2026. After that, we revised the manual according to the client's comments.
The installed app reads 76 Tags from 3 measurement boxes, plus values from another 5 machines through a Gateway. This work has no figures yet measuring maintenance results, because the client's acceptance of the work is in progress, so we report only what documents confirm.
What we learned
This work offers 3 principles for connecting software to existing measuring equipment.
- Check the existing equipment's data channels, both outgoing and incoming, before designing functions. In this work, the measurement box could output values but had no API for receiving thresholds and no API for sending analysis text, so thresholds sit in the app and the app shows the Event list instead.
- Equipment and data supplied by the customer are conditions of the work plan. In this work, the sensors and data from the customer arrived later than planned, so these items and the dates they must be received should be stated in the plan from day one.
- Alerts need someone to acknowledge them and a history. The acknowledge button, history screen and repair note field let the team know which alerts someone has already taken up and which machines have recently been attended to.
How this approach can apply to your factory
If your factory already has a vibration monitoring system, you can use the same approach as this case: read values from the existing equipment, store them on a server inside the factory, then show the status on tablets. What needs adapting is how the data is read, when your equipment is another brand or outputs data through a different channel.
Reusable parts and parts that need adapting
| System part | Reusable | Needs adapting when |
|---|---|---|
| Reading values | Reading values from the measurement boxes and Gateway | If the equipment is another brand, first check which channels it can output data through |
| Data storage | Python FastAPI back end and PostgreSQL on a server inside the factory | There is no server in the factory yet, or IT policy specifies a different place to store data |
| Screen | The InCBM app's factory layout, status colours, trend graphs and alert history | Requires your factory's own layout, machine list and photos of the actual machines |
| Alert thresholds | Setting thresholds separately by sensor and by axis | Your maintenance team must define the Watch and Critical ranges for each type of machine themselves |
- Check how the existing measuring equipment can output data, and whether it can receive thresholds or commands back
- Prepare the complete factory layout, machine list and photos of the actual machines with sensor positions from the outset, because they are the main content of the screens
- Tablets must connect over Wi-Fi to the same network as the factory server, and the display should be tested on every tablet model that will actually be used
- Agree clearly who acknowledges alerts and who records repairs in the app
Read more
- InCBM machine condition monitoring system
- Predictive Analytics: analysing machine data in advance
- System development service tailored to factory requirements
- Case: reading fan balancing machine values with OCR and calculating vibration values
- Case: AI system for searching valve repair history for oil refinery maintenance
- Case: mould shot counting and maintenance cycle alerts by email
- Article: mould maintenance cycle reminders using Shot Count
Technology used
Frequently Asked Questions
Do all the sensors need to be newly installed?
Not always. In this case, the sensors and measurement boxes were already installed, and we developed only the software that reads values from that equipment. If your factory does not yet have measuring equipment, a site survey is needed before an approach is proposed.
Can we set our own alert criteria?
Yes. Users can set Watch ranges separately for each sensor and enter the message to display with an alert. For machines that send values through a Gateway, thresholds can be set separately for Velocity on the X, Y and Z axes and for the impact wave value. These thresholds are used within the app and are not sent back to change values on the measurement box.
Where is the vibration data stored?
In this case, the back end and PostgreSQL database run on a server inside the factory. If your factory has a policy on where data is stored, please tell us during the survey stage so that the server location can be planned to match the policy.
Can it be used with measuring equipment from other brands?
This case connects to measurement boxes and a Gateway. For other equipment, first check which channels it can output data through, then assess the work of connecting it to the app.
Has this work been completed yet?
We have installed the app on 2 factory tablets and supplied the user manual. Client acceptance testing is currently in progress