




A system for monitoring 7 CNC lathes via OPC UA and recording roller measurements on Grafana for a manufacturing factory in Thailand
Customer: A large manufacturing group in Thailand
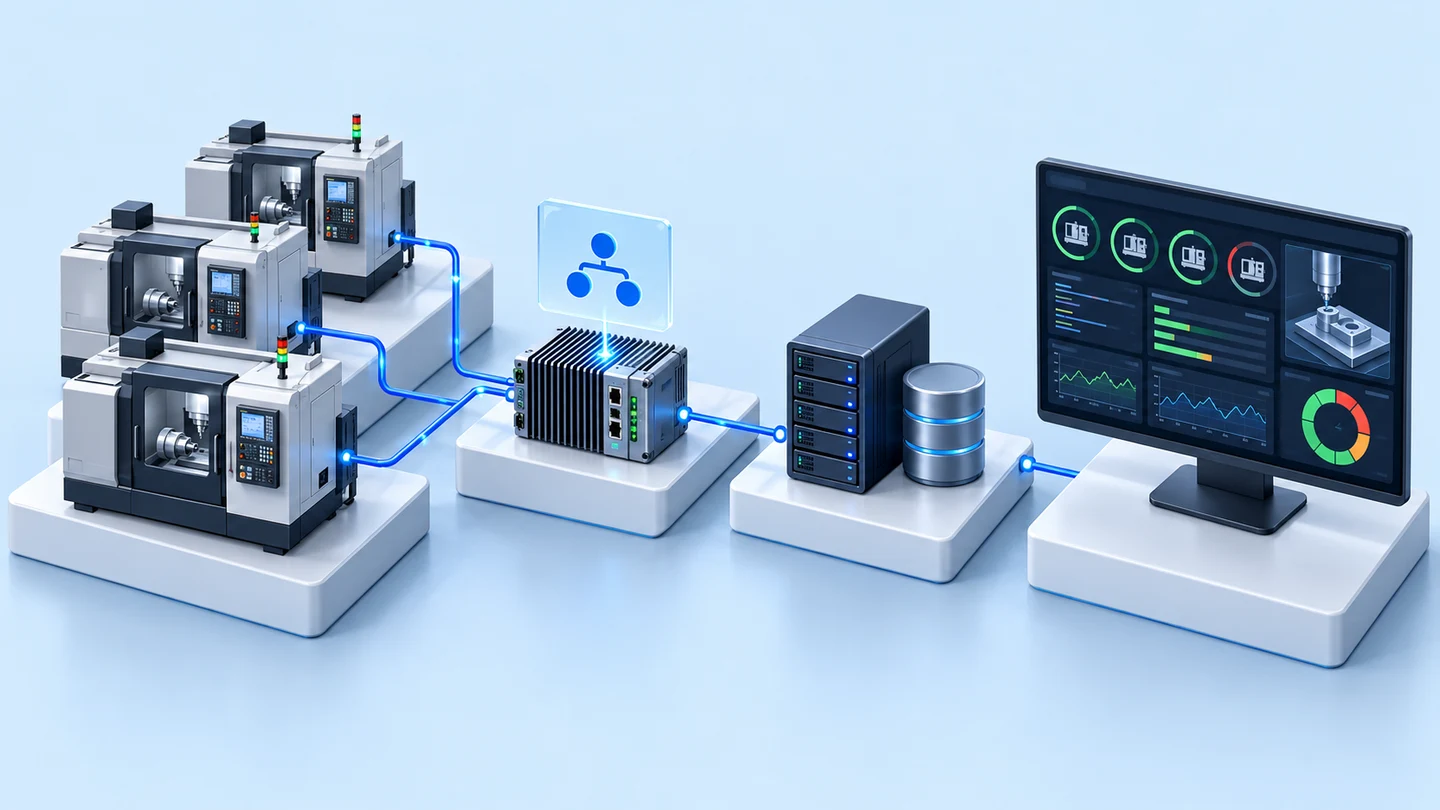
This case is a system that brings the status of 7 CNC lathes and roller measurements together on a Grafana dashboard on a server inside the factory. Node-RED reads machine values via OPC UA every 5 seconds and writes measurements from a tablet back to the factory's existing Roller database. We delivered the system with project closure documents to a manufacturing factory in Thailand in September 2026.
- Industry
- General manufacturing
- Year
- 2025–2026
- Scope of work
- 2 Grafana pages (Overview and Input) with a Custom Plugin for sending data; an API on Node-RED connecting Grafana to the MS SQL Server database; reading data from 7 CNC machines via OPC UA every 5 seconds into InfluxDB; system testing and project documentation. Includes additional work in 2026: analysing and writing data retrieval commands (Query) for the factory's existing database.
Summary
- We connected 7 CNC lathes on the roller turning line via OPC UA, with Node-RED reading values every 5 seconds and storing them in InfluxDB on a server inside the factory.
- The Overview page on Grafana shows the main motor status light, program status, Alarm and Cycle Time (time per work cycle) in minutes for each machine on one screen.
- The QC (quality inspection) department records roller diameter, width and eccentricity through the Input page on a tablet, and an API on Node-RED writes the values back to the existing Roller database on MS SQL Server.
- During the project, the customer agreed to show Cycle Time instead of job completion time, because OPC UA could not send the data needed to calculate it from G-code (the set of instructions a CNC machine uses to turn a workpiece).
- The main work began in 2025, the customer ordered additional analysis of the existing database in 2026, and we delivered the system with project closure documents in September 2026.
The on-site brief
The status of the 7 CNC lathes on the roller turning line sat in the I-Link software connected to the machines, while roller sizes measured after turning had to be recorded in the factory's existing Roller database on MS SQL Server. The customer's team wanted to see machine status, roller sizes and production time from one place, and wanted the database values to match the sizes actually measured.
What we did
We installed Node-RED (a tool for connecting and processing data) on a server inside the factory to read CNC machine values via OPC UA (a common standard for exchanging machine data) every 5 seconds and store them in InfluxDB (a database for time-based data). Grafana (dashboard software) has 2 pages: an Overview page for viewing machine status and an Input page on a tablet for recording measurements from a digital vernier caliper. Measurements are written back to the existing Roller database through an API (a channel through which programs exchange data) that we built on Node-RED.
Results
We delivered the system with project closure documents in September 2026. The Overview page shows status, Alarm and Cycle Time (time per work cycle) for all 7 CNC machines on one screen, and roller measurements from the Input page are written back to the existing Roller database.
How the brief came about
The brief in this case was to see the status of 7 CNC lathes (computer-controlled lathes) and roller measurements from one place. Both sets of data already existed, but in separate systems. Machine status sat in the I-Link software connected to the machines, while roller sizes measured after turning had to be recorded in the factory's existing Roller database on MS SQL Server.
The customer wanted users to see roller sizes, measurements and production time clearly, and wanted the values in the Roller database to match the sizes actually measured every time. On a line with several machines, if the data sits in different places, knowing which machine is running, which has stopped or which has an Alarm (a signal warning of a machine fault) means checking one point at a time.
What is OPC UA?
OPC UA is a common standard for exchanging data between industrial machines and software. If a machine or its control software exposes data via OPC UA, external systems can read status, Alarm and various counters without writing a brand-specific connector.
Requirements and constraints
The system had to work with the software and databases the factory already uses and follow the policies of the customer's IT department. The main requirements and constraints are as follows.
- Installed on a server inside the factory and running on the customer's network
- Read machine data via OPC UA from the I-Link software already connected to the CNC machines
- Customer policy does not allow pulling data directly from the existing database. Reading from and writing to the Roller database must go through an API.
- Measurements must be recorded in the existing Roller database so that the database values match the sizes actually measured.
- Grafana is not a fully custom-built web application. Its appearance and data entry work within Grafana's limitations.
How does the system read CNC machine status and receive roller measurements?
The system reads machine status via OPC UA and receives roller measurements through the Input page on Grafana, opened from a tablet. Both data paths are shown on a single dashboard. We read machine data via OPC UA from the I-Link software already connected to the machines, and write measurements through an API on Node-RED, because customer policy does not allow pulling directly from the database.
- 1
Read machine status via OPC UA
Node-RED pulls values from all 7 CNC machines via OPC UA every 5 seconds, such as program status, Alarm, rotational speed and Cycle Time, and stores them in InfluxDB.
- 2
Show an overview on the Overview page
Each machine has a main motor status light (green means running), Run/Stop program status, an Alarm light (red means the machine has a problem) and Cycle Time, converted from seconds to minutes before display.
- 3
QC records roller measurements through the Input page
After turning is finished, the QC (quality inspection) department selects the machine, the roller and the position on the roller. Diameter and width values are received from a digital vernier caliper, while the eccentricity values for both sides are entered on the tablet. The system calculates the difference between the eccentricity values immediately.
- 4
Write back to the existing database
When save is pressed, the API on Node-RED saves a new value or updates the existing value in the Roller database on MS SQL Server.
- 5
View the table of latest measurements
A table on Grafana shows the latest values for each roller position: current size, amount removed by turning (Cutdown), and latest diameter and width.
Deliverables
We delivered the complete software set on a server inside the factory, together with system testing and project documents. The deliverables are as follows.
- Overview page on Grafana: main motor status, program status, Alarm and Cycle Time for all 7 CNC machines
- Input page on Grafana with a Custom Plugin (an add-on we wrote) for sending roller measurements
- Table of latest measurements for each roller position
- Reading machine data via OPC UA with Node-RED and storing it in InfluxDB
- API on Node-RED connecting Grafana to the existing Roller database on MS SQL Server
- Additional work in 2026: analysing the factory's existing database and writing data retrieval commands (Query)
How did the scope of work change during the project?
The scope changed in the areas of screens and the measurement table, and every change arose from data or tool limitations found during development. Each change was recorded in the project closure documents, as follows.
- Cycle Time instead of job completion time: the original plan was to calculate job completion time from G-code (the set of instructions a CNC machine uses to turn a workpiece), but OPC UA could not send that part of the data, so the Overview page shows the Cycle Time of each machine instead.
- Some columns removed from the measurement table: columns that needed to refer back to roller sizes in the existing database were removed, because the structure of the existing database could not support that reference.
- Input fields combined in one panel: Grafana's standard Plugin could not send data as text, so we combined the input fields in one panel and wrote a Custom Plugin to send the data.
The main work began in 2025. Later, in 2026, the customer ordered additional work to analyse the factory's existing database and write data retrieval commands (Query).
Results confirmed from the delivery
The evidence for this work is the project closure document (Product Document), which records the delivered screens and the changes to screen scope during the project. Besides the Overview and Input pages, the document also shows the table of latest measurements for each roller position. This table shows current size, amount removed by turning, and latest diameter and width.
This case has no measured business figures, such as reduced machine downtime, so we report only what was delivered and is backed by documents.
What we learned
This work offers the following principles for projects that connect machine data to a factory's existing systems.
- Check which Tags (data items) the machine can actually send via OPC UA before designing the screens. Values that must be calculated from data the machine does not output cannot be displayed. In this case, job completion time therefore had to change to Cycle Time.
- Agree with the IT department how to access the existing database before development starts. In this case, policy did not allow pulling directly from the database, so the integration work had to wait for the API, and the meeting on connectivity between the IT team and the site team was postponed.
- Design screens around the limitations of the tools and the structure of the existing database, and set out the screen scope clearly in writing. Grafana is not a fully custom-built web application, and the existing database determines which columns can actually be shown.
How this approach can apply to your factory
If your CNC machines or their control software expose data via OPC UA, you can use the same approach as this case: read machine status into Node-RED, store it in InfluxDB, display it on Grafana and write measurements back to the database your factory already has. What needs adapting is the machines' Tag list and the way your existing database is accessed.
Reusable parts and parts that need adapting
| System part | Reusable | Needs adapting when |
|---|---|---|
| Reading machine data | Reading values via OPC UA with Node-RED and storing them in InfluxDB | The machine or its control software does not expose data via OPC UA, or exposes a different set of Tags. A site survey is needed first. |
| Overview page | Main motor status light, program status, Alarm and Cycle Time per machine | You need values the machine does not output, such as job completion time. You must check whether data is available to support them. |
| Input page | Receiving values from a digital vernier caliper on a tablet through a Custom Plugin | The workpiece or the values to be measured differ from rollers. Input fields and calculations must be defined anew. |
| Writing back to the database | API on Node-RED that saves or updates values in the existing database | Your database is a different system, or your IT department sets permissions differently from this case. The tables and connection method must be agreed anew. |
- Ask for the list of tags the machine can actually send via OPC UA before finalising the screens
- Finish agreeing permissions, tables and the method of connecting to the existing database with the IT department before development starts
- Set out the screens and data required on the dashboard in writing, checked against the limitations of Grafana
Read more
- Custom inspection and control system development service
- Data integration and AI development services for organisations
- InGauge digital measuring instrument signal-to-USB converter
- Case: Sending digital vernier caliper values to automatic QC reports
- Case: consolidating production data inputs on a central server
- Article: storing factory data on an in-house server or in the cloud
Technology used
Frequently Asked Questions
Which CNC machines can this system be used with?
It can be used when the machine or its control software exposes data via OPC UA. In this case, the system reads from the OPC UA of the I-Link software already connected to the machine. For other machines, a site survey and a review of the tag list are needed before this can be confirmed.
Do we need to replace the factory's existing database or software?
In this case, the existing database was not replaced. The system writes measurements back to the existing Roller database on MS SQL Server through an API on Node-RED, only to the tables and columns agreed, and operates in line with the customer's network policy. Your connection will depend on the structure and permissions agreed with the IT department.
Why show Cycle Time instead of the time a job will finish?
Because OPC UA cannot send the data needed to calculate the time a job will finish from the G-code. The original plan was to calculate this value, but during the project the customer agreed to display each machine's Cycle Time in minutes instead.
Where is the data stored?
The data is stored on a server inside the factory. Machine data is held in InfluxDB, while roller measurements are held in the customer's existing Roller database.
What are the price and timeframe?
There is no fixed price. It depends on the number of machines, the data to be read and the existing systems to be connected. Please contact us to request a quotation after a site survey.