




A system for sending vernier digital gauge values into quality control reports and automatically calculating Cpk for automotive parts manufacturers in Thailand.
Customer: Automotive parts manufacturer (Japanese conglomerate)
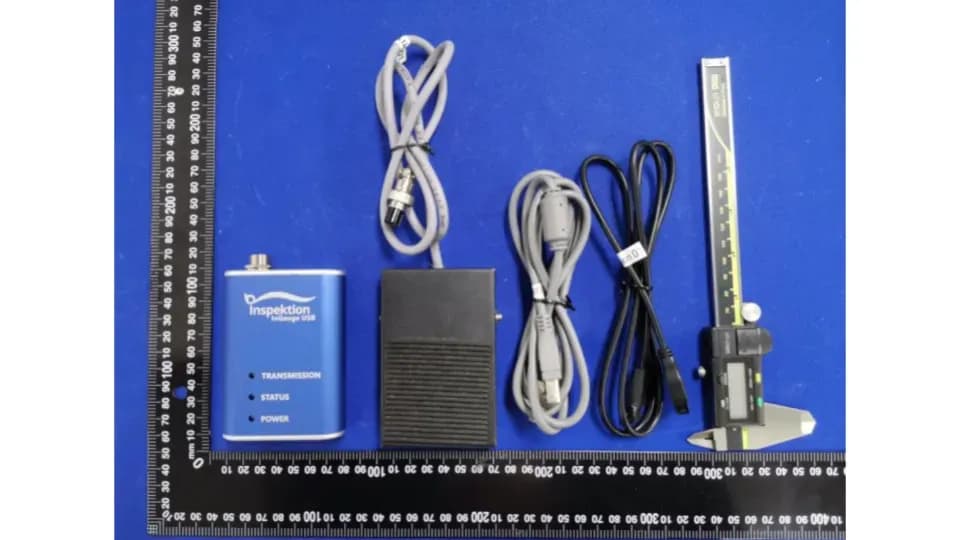
This quality reporting (QC) web app receives readings from Mitutoyo digital calipers directly into reports, automatically plots X̄-R control charts, and calculates Cpk. Readings reach the system in 2 ways: through an InGauge USB adapter or a U-WAVE wireless transmitter. We developed it for an automotive parts manufacturer in Thailand and delivered it in January B.E. 2564
- Industry
- Automotive
- Year
- 2020–2021
- Scope of work
- A quality reporting web app on 1 Siemens IPC server at the factory, with an overview layout page (Quality Layout) showing 33 production lines and report pages for machines connected to Mitutoyo digital vernier calipers through InGauge USB and U-WAVE, starting with machines in one production area of the factory. Delivered 10 sets of InGauge USB, 10 tablets, 1 wireless router, a user manual and acceptance documents. The project started in 2020 and closed in 2021.
Summary
- This system is a QC report web app that takes values from Mitutoyo digital vernier calipers directly into the report, replacing writing values on paper and calculating them by hand.
- The Vernier sends data to the system in 2 ways, either through the InGauge USB converter or through the wireless U-WAVE transmitter.
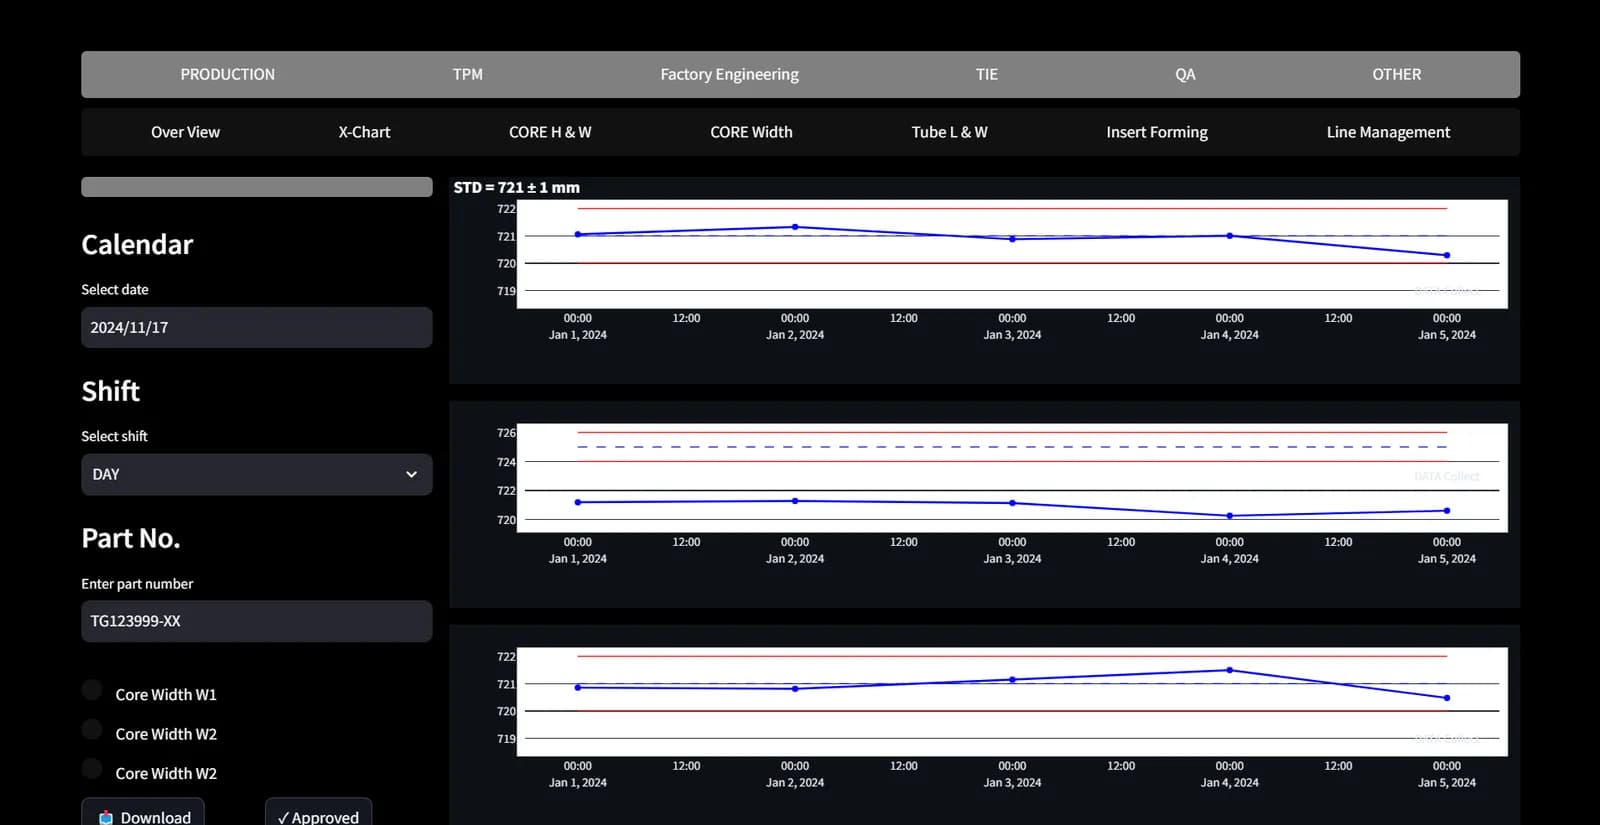
- The system draws X̄-R control charts by shift and part number, calculates Cpk for each measuring point against the 1.33 criterion, and calculates the monthly control limits (UCL/LCL) by itself.
- The system is installed on the factory's Siemens IPC server and used on the internal LAN. The overview layout page shows 33 production lines, with the report pages that receive vernier caliper values starting from machines in one production area.
- We delivered the system with 10 sets of InGauge USB, a user manual and acceptance documents in January 2021, then made adjustments following change requests until the project closed in 2021.
The on-site brief
QC staff measured workpieces with digital vernier calipers but still had to write the values on paper, then calculate Cpk (process capability index) and other statistical values themselves before issuing reports. The customer wanted measured values to go directly into the report and the system to calculate these values.
What we did
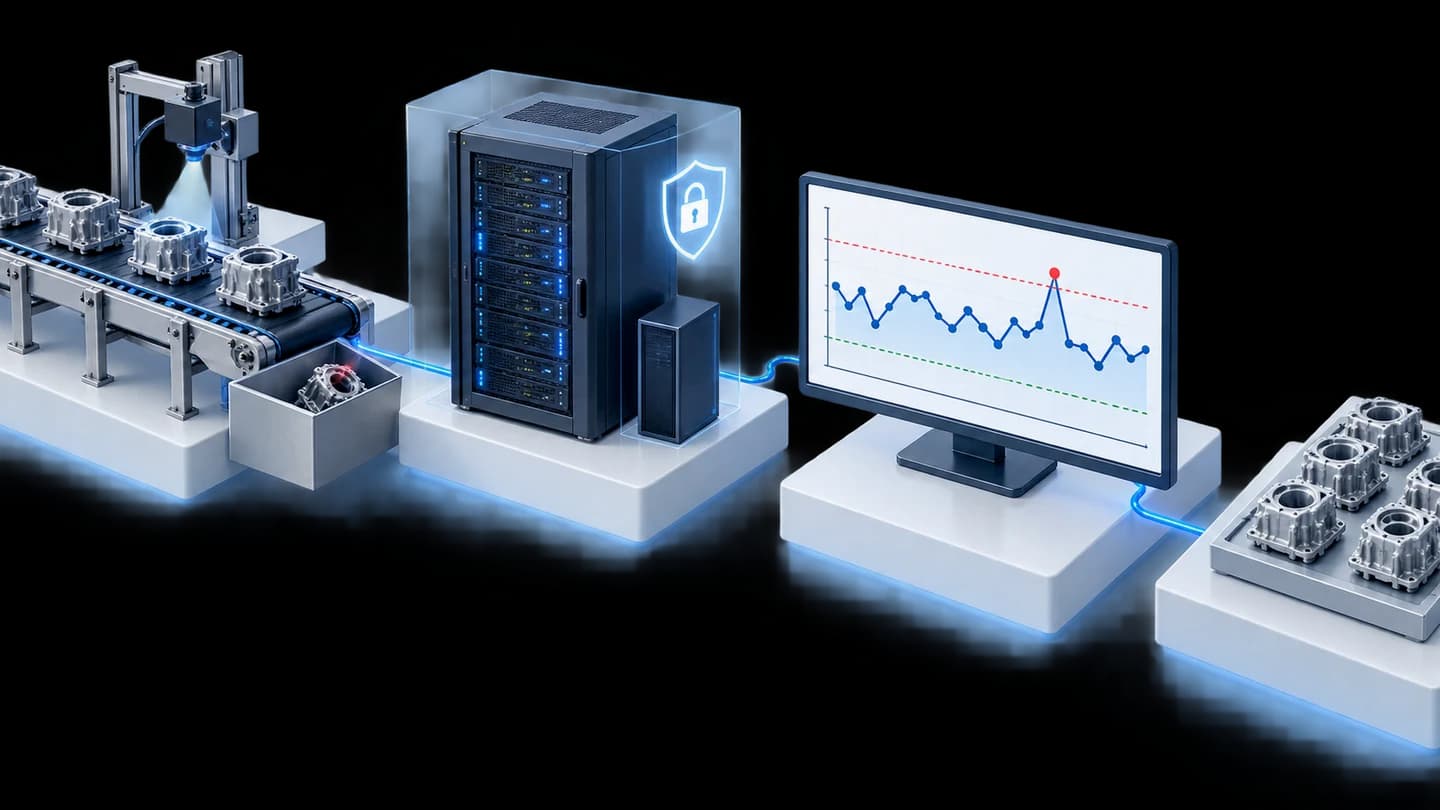
We developed a quality reporting web app on the factory's Siemens industrial server (IPC), used through a web browser on the internal LAN without needing to connect to the internet. Vernier calipers send values to each machine's report page through InGauge USB or U-WAVE. The system then draws X̄-R control charts, calculates Cpk for each measuring point against the 1.33 criterion, and calculates the monthly control limits (UCL/LCL).
- Mitutoyo digital vernier gaugeQC staff measure the workpiece
- InGauge USB or U-WAVESends the measured values into the system
- QC report web appOn a Siemens IPC server on the LAN
- X̄-R control chart and CpkCalculated automatically
- View reports in a web browserBy shift and part number
Results
We delivered the system with equipment, a user manual and acceptance documents (Exit Criteria) in January 2021, then made further adjustments following the customer's change requests until the project was closed as completed work in 2021. QC staff can send vernier caliper values directly into the report, without writing them on paper or calculating Cpk themselves.
How the brief came about
The challenge in this case was to get values measured by digital vernier calipers directly into the quality report and have the system calculate the statistical values. Previously, QC staff measured workpieces with digital vernier calipers, wrote the values on a paper form, then calculated Cpk and other values themselves before issuing the report.
When figures have to be written down and calculated by hand, the same set of figures passes through people's hands several times, and each pass is a chance to misread or miscalculate. The customer, an automotive parts manufacturer in Thailand, therefore wanted reports that receive values from measuring tools and do the calculations themselves.
What is Cpk?
Cpk (process capability index) shows how far the values produced are from the upper and lower specification limits. The higher the value, the more margin the process has before defects occur. In this case, the system calculates Cpk for each measuring point and compares it with the 1.33 criterion set by the customer.
Requirements and constraints
The system had to work with Mitutoyo digital vernier calipers and the factory's server without connecting to the internet. The main requirements and constraints are as follows.
- Installed on the factory's Siemens industrial server (IPC), running Windows 10, and operating on the internal LAN only.
- Receive values from Mitutoyo digital vernier calipers both by cable through InGauge USB and wirelessly through U-WAVE.
- The report header must automatically pull in the part number, the date and the preset upper and lower specification limits (USL/LSL).
- Charts can be viewed by day shift, night shift or the whole day, and by part number.
- Calculate Cpk for each measuring point against the 1.33 criterion, and calculate control limits (UCL/LCL) from the whole month's data for use in the following month.
- Points out of specification (NG) must allow problem details to be recorded, and administrators must be able to specify users and report download permissions.
- Sending email from the system must wait until the factory's IT department enables the internal email server (SMTP).
How do vernier caliper values get into the report?
Vernier caliper values reach the report through a signal transceiver connected to the caliper, then go straight into the fields of the report page in the web app. QC staff still measure workpieces following the same procedure, but do not have to type or write down the values themselves. The vernier caliper can send values in 2 ways: through the wired InGauge USB signal converter, or through Mitutoyo's U-WAVE wireless transmitter.
The job requirement was a web app on the factory's server working offline on the internal LAN. Machines on the same LAN can therefore open the report page in a web browser. The system's workflow is as follows.
- 1
Measure the workpiece and send the value to the system
QC staff measure the workpiece with a Mitutoyo digital vernier caliper, then send the value to the system through the InGauge USB signal converter or by pressing the button on the U-WAVE wireless transmitter attached to the caliper.
- 2
Select a machine from the overview layout page
The overview layout page (Quality Layout) shows the production line layout and can be filtered to show only the lines you need. Users click a machine that has a report page to open that machine's report.
- 3
Values fill the report table automatically
Measured values are arranged in the table in measuring-point order. The system immediately totals the results and finds the average of each set, and puts the part number, date and USL/LSL values in the report header.
- 4
Draw control charts and calculate Cpk
The system draws X̄-R control charts (average and range) by shift and part number, calculates Cpk for each measuring point, then shows the status against the 1.33 criterion.
- 5
Record problems and manage permissions
Points out of specification (NG) can have problem details recorded. Administrators use the Line Management page to manage users and approve report download permissions.
Deliverables
We delivered the QC report web app with 10 sets of InGauge USB, 10 tablets and 1 wireless router to an automotive parts manufacturer in Thailand in January 2021. The delivered items are as follows.
- Quality reporting web app, installed on 1 Siemens IPC server at the factory
- Overview layout page (Quality Layout) showing 33 production lines, and report pages for machines connected to vernier calipers, starting with machines in one production area of the factory
- Report pages with a table of measured values, X̄-R control charts, Cpk status, monthly control limits and problem recording for NG points
- Line Management page for managing users and report download permissions
- Equipment: 10 sets of InGauge USB, 10 tablets and 1 wireless router
- User manual and acceptance documents (Exit Criteria)
What was adjusted and added to the system after delivery?
After delivery, we adjusted the system following the customer's change requests (Change Requirement) several times in 2021. The main topics were shift times, separating genuinely defective parts from the chart, and managing users and report download permissions. We also moved some of the code from PHP without a framework to Laravel. The sequence of work is as follows.
- 2020: Project started; web app and report pages developed
- January 2021: Delivered the system, equipment, user manual and acceptance documents
- 2021: Adjusted shift times, added a tick box to keep genuinely defective parts out of chart plotting, added management of users and secondary administrators (Sub Admin), and added report download permission requests
- 2021: Project closed as completed work
Results confirmed from the delivery and project closure
The confirmed results are that we delivered the system with acceptance documents in January 2021 and closed the project as completed work in 2021. After delivery, QC staff can send vernier caliper values directly into the report and the system calculates Cpk, with no need to write values on paper.
This case has no measured business figures, so we report only the results backed by documents.
What we learned
The key principles from this work are to capture values at the source, separate specification limits from control limits, and agree early on any work that relies on the factory's IT systems. The details of each are as follows.
- Capture values at the source, then have every calculation use the same set of values. When the measuring tool sends values directly into the report, the table, chart and Cpk come from the same set of figures, with no need to copy them across several times.
- Separate specification limits from control limits. USL/LSL are specifications set per part number, whereas UCL/LCL are calculated from actual data of the previous month. The system must show these two values separately, and it must be clearly agreed which data goes into the chart, such as shift time boundaries and genuinely defective parts that should not be plotted.
- Functions that rely on the factory's IT systems must be agreed with the IT department from the start. In this work, sending email from the system had to wait for the IT department to enable internal SMTP.
How this approach can apply to your factory
If your factory already uses digital measuring tools but still writes values on paper, you can use the same approach as this case: send values from the measuring tools directly into the report, and let the system calculate the control charts and Cpk. What needs adjusting is the report form, the measuring points and the way the measuring tools connect, depending on the models you use.
Reusable parts and parts that need adapting
| System part | Reusable | Needs adapting when |
|---|---|---|
| Receiving values from measuring tools | InGauge USB signal converter or U-WAVE wireless transmitter | If your measuring tool is a different model or brand, first check whether it has a data output port (Digimatic/SPC). |
| Report page | Table of measured values by measuring point, totals and averages | If your form, number of measuring points or USL/LSL values differ from this case, the report page must be designed around your actual form. |
| Control charts and Cpk | X̄-R charts, Cpk status and monthly control limits | If your factory uses a different Cpk criterion, shift times or control limit calculation method, the formulas must be agreed before development starts. |
| Users and permissions | User management and approval of report download permissions | If your factory's approval sequence differs, the administrator roles must be redefined. |
| Installation | Web app on a server in the factory, used on the LAN | If you need the system to send email, the IT department must first enable internal SMTP. |
- Start with a frequently used form that has clear measuring points. Once the formulas and report page are settled, expand to other machines and lines.
- Define the system administrators and the user permission approval sequence from the start.
Read more
- InGauge: a signal converter that sends values from digital measuring tools to a computer via USB
- Case: ITAP program developing InGauge USB version 2.1
- Case: P-Chart Control web app on a factory server
- Article: What are SPC and P-Chart, and how do factory managers read control charts?
- Custom system development service
Technology used
Frequently Asked Questions
How does a vernier caliper send values to the system?
In this case there are 2 options: connect a Mitutoyo digital vernier caliper to an InGauge USB signal converter, or use a U-WAVE wireless transmitter attached to the vernier caliper. Once a measurement is complete, the value goes into the report field in the web app with no manual typing.
What does the system calculate?
The system combines the results and averages each set, draws X̄-R control charts separated by shift and part number, calculates Cpk for each measuring point and shows its status against the 1.33 criterion, and calculates control limits (UCL/LCL) from the full month's data for use in the following month.
Does it need an internet connection?
No. The system in this case is installed on the factory's IPC server and runs on the internal LAN. Devices on the same LAN can open the report page through a web browser.
Can it be used with measuring instruments other than vernier calipers?
InGauge supports digital measuring instruments with a Digimatic/SPC port. The report page in the web app, however, has to be designed around the form and measuring points of each job. We need to see the instrument model and the actual report form before we can confirm.
What are the price and development time?
The price of the InGauge signal converter is shown on its product page. The quality report web app is custom development for each factory, so its price and timeline depend on the number of report forms, the calculation formulas and the number of machines. Please contact us to request a quotation.