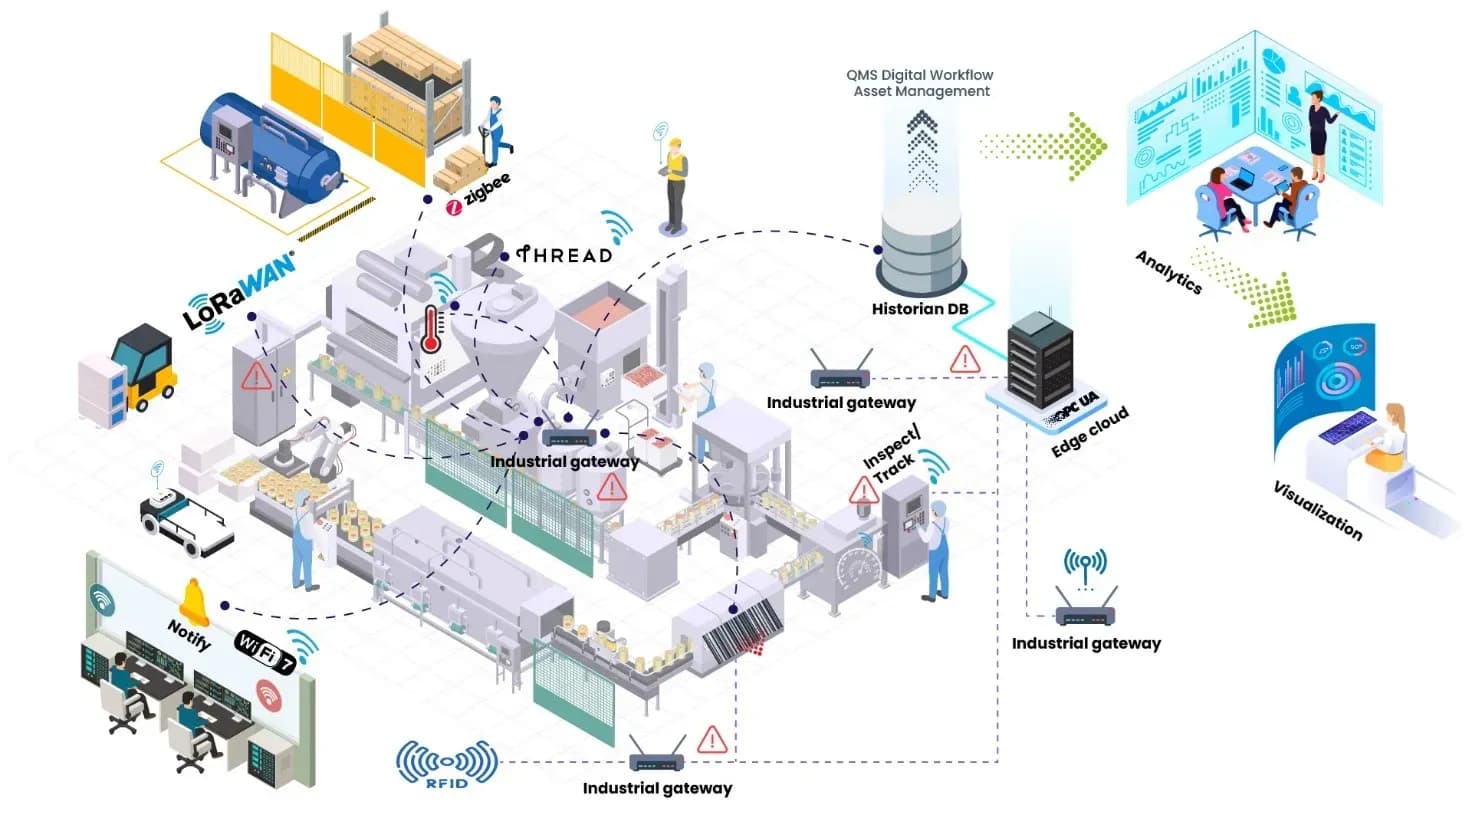





P-Chart Web App records defects on server in factory for automotive parts manufacturers in Thailand
Customer: Automotive parts manufacturer (Japanese conglomerate)
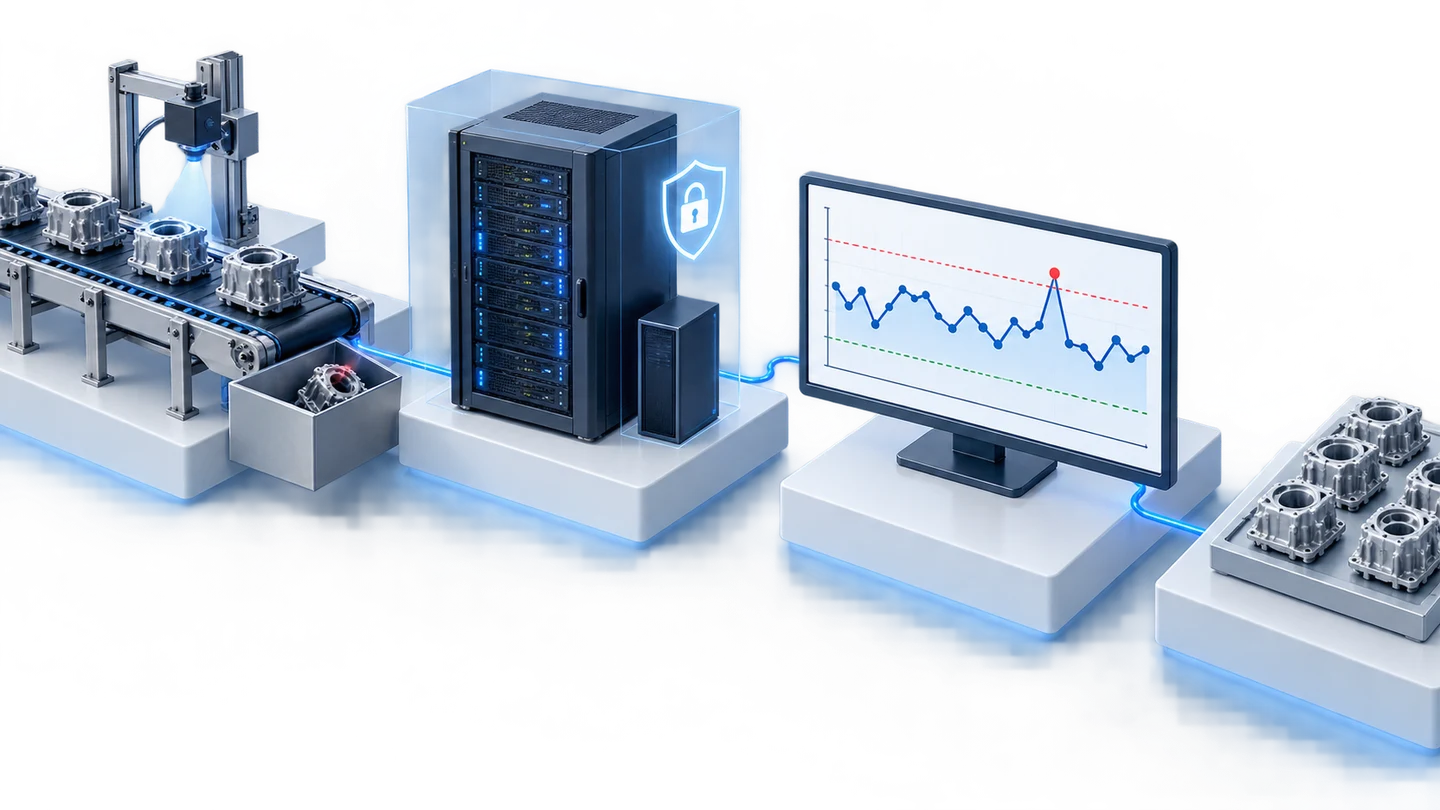
P-Chart Control is a web app that allows production teams to record daily defects, view control charts, summarize defects, and export PDF reports all in one system. We developed and installed this system on the factory's own server (On-Premises) for automotive parts manufacturers in Thailand. The project was signed off by customers in April B.E. 2568.
- Industry
- Automotive
- Year
- 2024–2025
- Scope of work
- Design, development, installation and testing of 1 P-Chart Control web app on the factory's server (users log in and production totals are retrieved through the API of the organisation's existing system), adjusted through several rounds of change requests from Dec 2024, together with development documents, an acceptance form and a user manual.
- Duration
- Started Sep 2024, delivered Apr 2025, with further improvements until mid-2025
Summary
- P-Chart Control is a web app that lets the production team record daily defects by shift instead of using paper P-Chart sheets and Excel, then automatically calculates the average line and upper control limit (UCL).
- The system retrieves production totals from the organisation's existing system through an API (a connection channel between systems), so staff enter only defect quantities.
- The system is installed with Docker (a container-based software installation package) on the factory's server (On-Premise) and stores data in PostgreSQL (database).
- An automotive parts manufacturer in Thailand signed acceptance of the work in April 2025 after the system passed the acceptance checklist. We then continued improving the system until the work closed in 2025.
- The main lessons from this work are to consider system speed before appearance, and to agree clear data rules before writing the back end.
The on-site brief
The production team recorded defect quantities daily on paper P-Chart sheets alongside Excel files, then summarised reports monthly. Data was therefore written down and copied through several steps before the monthly report was ready. The factory wanted a web app running on its own server.
What we did
We developed the P-Chart Control web app with Next.js, stored data in PostgreSQL (database) and installed it with Docker on the factory's server. The system accepts daily defect records by shift, automatically calculates the average line and upper control limit (UCL), summarises defects with a Pareto Chart and exports the P-Chart as a PDF.
Results
The system passed the acceptance checklist (Exit Criteria) and the customer signed the delivery and acceptance form in April 2025. After delivery, we continued improving the system at the customer's request until the work closed in 2025.
How the brief came about
The task was to move work previously split between paper and Excel into a single web app. The web app had to accept defect records by shift, line and workpiece, and store defect targets at both line and organisation level. Charts, records of abnormalities and corrections, and reports all had to use this same data set.
What are P-Chart and UCL?
P-Chart (control chart for proportion of defectives) is an SPC (statistical process control) tool that shows whether each day's proportion of defectives is abnormal by comparing it with the average line and the upper control limit (UCL: Upper Control Limit). A point above the upper control limit is a signal to look for the cause. The UCL line is calculated from the process's own data, so it is not the defect target set by the factory.
Requirements and constraints
The system had to run on the factory's server and use data from the organisation's existing system. The main requirements from the scope of work, requirements document and acceptance checklist were as follows.
- Install 1 system on the factory's server (On-Premise) using Docker on Ubuntu Server, and store data in PostgreSQL
- Users log in through the API of the organisation's existing system
- Production totals used to calculate the proportion of defectives are retrieved from the existing system through an API, while staff enter defect quantities
- Defect types (Defect Type) are a fixed list set by the system. Users add their own defect items (Defect Mode) under those types
- The system must keep a history of every entry, and deleted items must be hidden from the screen
- Users can set defect targets at both line and organisation level
- Incomplete test data was identified as a risk factor in the scope of work
What data does this system use to calculate the P-Chart?
The system calculates the P-Chart from the defect quantities staff enter for each shift and the production totals retrieved from the factory's existing system through an API. It uses these two values to calculate the daily proportion of defectives, the average line and the upper control limit (UCL) according to the formula in the requirements document, then displays them as a chart.
The charts, summary page and PDF reports read from the same database, so data is recorded once on the shop floor instead of being copied through several steps as before. The screens were developed with Next.js and Ant Design (web app development tools), so staff use the system through a web browser.
- 1
Set up master data
On the master data settings page (Master Data), users register defect items for each line and workpiece under the defect types set by the system, along with defect targets at line and organisation level.
- 2
Daily defect records
Staff select the date, shift, line and workpiece, then enter defect quantities in a table. The system keeps a history of every entry that can be searched, edited or deleted, and deleted items are hidden from the screen.
- 3
Automatic P-Chart calculation
The system compares defect quantities with production totals from the existing system, calculates the daily proportion of defectives, the average line and the upper control limit (UCL), then displays them as a chart.
- 4
Record abnormalities and corrections
When defects exceed the threshold, the person responsible records the problem, cause and correction in the Abnormal Occurrence & Action Record table (record of abnormalities and corrections), linked to that day and workpiece.
- 5
Summarise results and export reports
The summary page shows daily, monthly and yearly defects with a Pareto Chart (a chart ranking defect items from most to least), and exports the P-Chart as a PDF or tables as CSV files (table files that can be opened in Excel).
Deliverables
We delivered 1 P-Chart Control web app on the factory's server, with screens covering all the steps above, from master data to report export. In addition to the web app, the deliverables were as follows.
- Docker installation package and PostgreSQL database on the factory's Ubuntu Server
- API connection to the organisation's existing system, for login and retrieving production totals
- Development documents
- Acceptance form
- User manual
Work steps and change requests
We developed the P-Chart Control web app from September 2024, delivered it in April 2025 and continued improving it until mid-2025. During development, the customer submitted several rounds of change requests (Change Requirement). Each round was recorded in a change request document, with its version updated per round. The sequence of work was as follows.
- Sep 2024: design and development began, based on the scope of work and requirements document
- From Dec 2024: the system was adjusted according to change requests, such as entry history, deletion by hiding items, and organisation-level targets
- Apr 2025: the system passed the acceptance checklist. The customer submitted another change request on combining totals when several people enter the same defect item, and signed the delivery and acceptance form
- After delivery until mid-2025: further improvements to the system, such as adding new defect items to the master data and adjusting the entry of organisation-level targets
Confirmed results from acceptance
The confirmed results of this case are the acceptance check and the signing for acceptance of the work. The P-Chart Control web app passed the acceptance checklist (Exit Criteria), and this automotive parts manufacturer signed the delivery and acceptance form in April 2025. The acceptance checklist covered entry history, deletion by hiding items and organisation-level targets, which came from change requests during development.
After delivery, the customer had us continue improving the system until the work closed in 2025. This case has no business measurement figures, such as report preparation time or reduced defect quantities, so we report only the results backed by documents.
What we learned
This work offers the following principles for daily quality data recording systems.
- System speed comes before appearance. The lesson the team drew after closing the work is that the system's working speed must be considered before appearance. The recording and chart pages of a system designed for daily recording should therefore be tested for speed with real data before the look is refined.
- Agree data rules before writing the back end. Change requests on entry history, deletion method and organisation-level targets arose during development, and when the scope changed to the point of requiring changes to the back end (Backend), the work took longer.
- A P-Chart can only be as correct as the production totals used to calculate it. Retrieving production totals from the existing system through an API means staff enter only defects, and the production totals come from the same system the organisation already uses.
How this approach can apply to your factory
If your factory still records defects on paper alongside Excel and uses a P-Chart to track the proportion of defectives, you can use the same approach as this case: record defects once on the shop floor, retrieve production totals from your existing system, and let the system calculate the charts, summaries and reports. What needs adapting is your factory's production total source, login method and report forms.
Reusable parts and parts that need adapting
| System part | Reusable | Needs adapting when |
|---|---|---|
| Defect recording | Daily recording page by shift, line and workpiece, with entry history | If your factory's defect items and defect types differ from this case, the master data must be set up again |
| Production totals | Retrieving production totals from the existing system through an API | If the factory does not yet have a system that sends production totals through an API, the data source or import method must be agreed first |
| P-Chart calculation | Automatic calculation of the average line and UCL line | If the factory uses a different formula or calculation cycle from this case, the formula must be specified in the requirements document |
| Login | Login through the API of the organisation's existing system | If the organisation uses a different authentication system, the connection must be redesigned |
| Installation | Docker and PostgreSQL on the factory's server | If the internal server is not ready, plan with the factory's IT team first |
| Reports | Export of the P-Chart as PDF and tables as CSV files | If your factory's report form is different, send a sample form for checking before design |
- Check which system production totals will come from, and request API connection rights from the start
- Prepare defect items, calculation formulas and real data samples for testing
- Reserve an internal server with the factory's IT team in advance
- Agree how change requests will be handled from the start of the project
Read more
- Custom inspection and control system development service
- Data integration and AI development services for organisations
- InQC, an SPC program on Android tablets for measured values
- Article: What are SPC and P-Chart, and how do factory managers read control charts?
- Article: On-Premise or Cloud: where should factory data be kept?
- Case: moving a production data website to a central server for an automotive parts manufacturer
- Case: prototype daily plan vs output board
Technology used
Frequently Asked Questions
Does this system have to send data to the cloud?
No. In this case, the system is installed with Docker on the factory's server and stores data in a PostgreSQL database on that machine. Staff use it through a web browser and log in through the API of the organisation's existing system.
Where do the production totals used to calculate the P-Chart come from?
In this case, the system retrieves production totals from the factory's existing system through an API, while staff enter defect quantities according to the configured defect items. The system then calculates the proportion of defectives, the average line and the upper control limit itself.
What happens if several people enter the same defect item?
The accepted system keeps a history of every entry, and deleted items are hidden from the screen. Combining totals when several people enter the same defect item was a change request from the April 2025 round, which specified that the system checks the latest total before saving and then adds to it, so that it does not overwrite another person's value.
How does this system differ from InQC?
P-Chart Control is a web application developed specifically to count the proportion of defective items according to this factory's forms. InQC, on the other hand, is an SPC program on Android tablets for recording measured values, such as workpiece dimensions. If your requirement is measuring values, see InQC. If it is counting defective items according to a factory's own specific forms, custom system development like this case would be more suitable.
What are the price and development time?
There is no fixed price. It depends on the number of screens, the calculation formulas and the systems that need to be connected. Development on this case began in September 2024 and it was delivered in April 2025. Please contact us with the forms you currently use to request a quotation.