




What is SPC and P-Chart? How does a factory manager read control charts?
Inspektion engineering team · Published 7 September 2026 · Last updated 18 October 2026
SPC (Statistical Process Control) is the use of statistics to control the quality of manufacturing processes, while P-Chart is a graph used to track daily defect rates. This article explains how to read the graph as a factory manager without needing to be a statistician.
Summary
- SPC (Statistical Process Control) uses statistical principles to monitor whether a production process is still within its normal range.
- A P-Chart is a type of control chart that tracks the proportion of defects (Defect Rate) in each production run.
- The chart has a centre line (CL) and upper and lower limits (UCL/LCL) — a point outside the limits signals that the process is abnormal and must be investigated immediately.
- You do not need to be a statistician to read the chart — what factory managers need to look at are the points outside the limits and the trend of the chart.
What is SPC?
What is SPC?
SPC (Statistical Process Control) uses statistical principles to monitor a production process continuously, in order to distinguish whether the variation that occurs is the system's normal variation or a signal that something is abnormal and needs correcting.
What is a P-Chart?
What is a P-Chart?
A P-Chart is a type of SPC control chart used to track the proportion of defects (Proportion Defective) in each production run, such as the daily or per-shift defect rate. It is better suited to data counted as "pass/fail" than to data measured as continuous numbers.
How to read a P-Chart
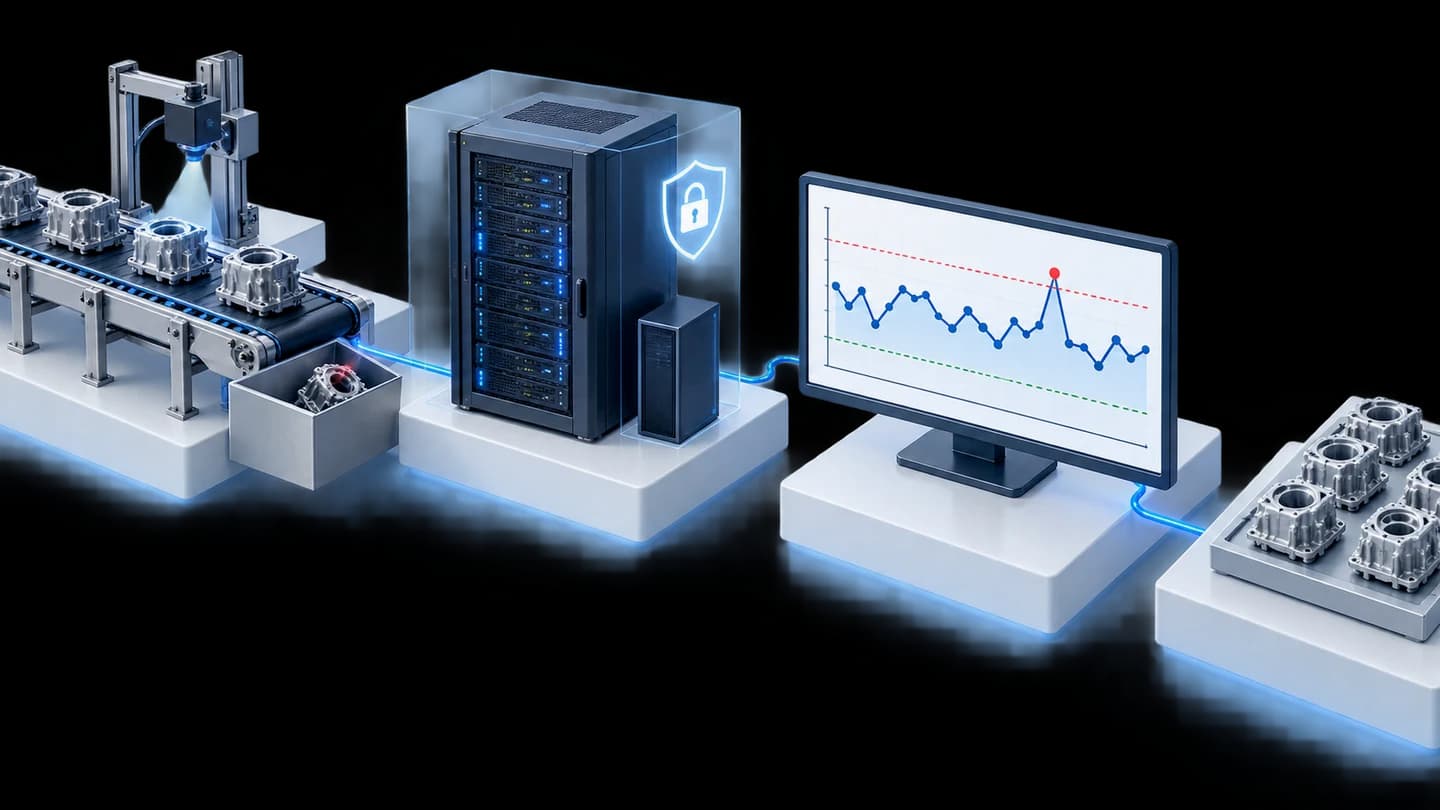
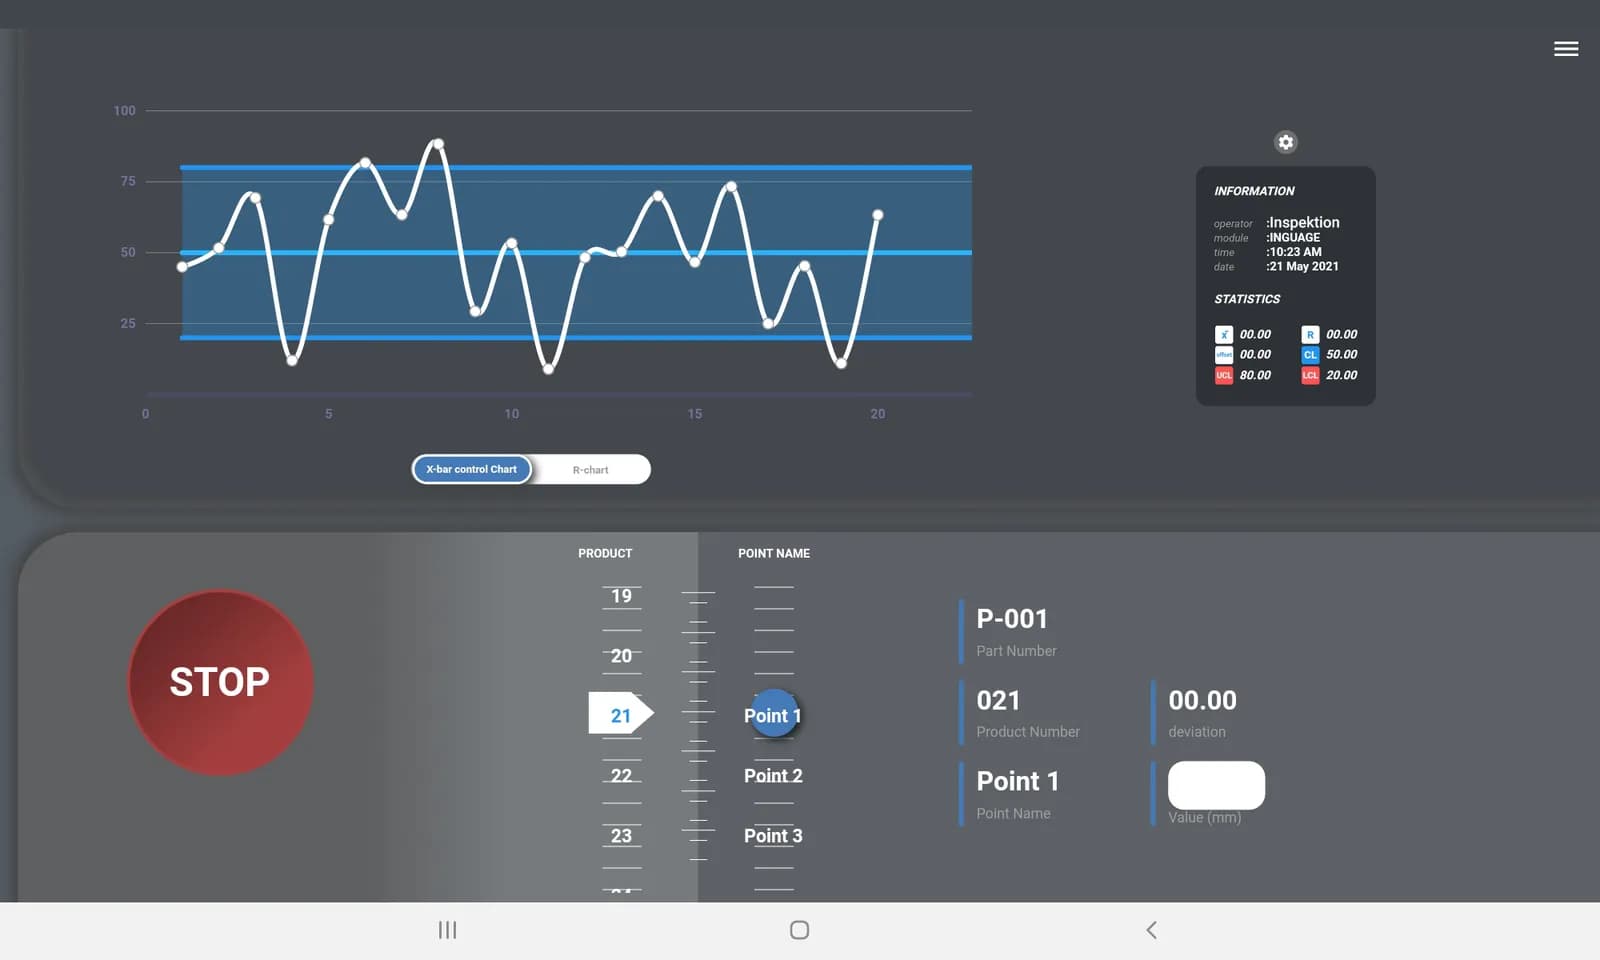
- The Centre Line (CL) is the average defect rate during a normal period.
- The upper limit line (UCL) and lower limit line (LCL) mark the boundaries within which the process is considered to be working normally.
- Any point outside the UCL or LCL line means the process is Out of Control, and the cause must be investigated immediately.
- Even if the points are still within the limits, a continuous upward trend over several consecutive points is also a warning sign worth watching.
Why factory managers should be able to read this chart
Waiting for the end-of-month defect summary report may be too late — a P-Chart helps reveal abnormalities from the day they occur, so factory managers can decide how to solve the problem in time, rather than learning of it after a large quantity of defects has already built up.
Examples of our real work
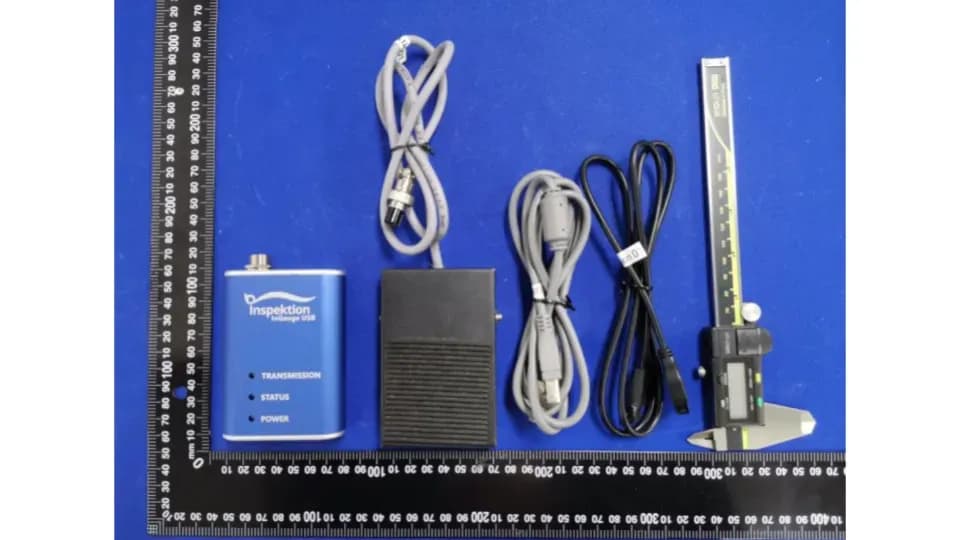
We developed a quality monitoring app with P-Chart Control for an automotive parts manufacturer in Thailand, installed On-Premise on servers inside the factory according to the project scope (view the case). You can also see products related to measuring and collecting quality data at InQC and InGauge.
Frequently Asked Questions
How does a P-Chart differ from other control charts?
A P-Chart is used with data counted as a proportion of defects (pass/fail), whereas other control charts, such as the X-bar chart, are used with data measured as continuous numbers (such as length or weight). Choose according to the type of data you have.
Do I need a background in statistics before using it?
No, it is not necessary — the system calculates the centre line and the upper and lower limits automatically. Users only need to see which points fall outside the limits and investigate the cause.
Can I set the UCL/LCL limits myself?
Yes — our team helps set the limits to suit the quality standard of each production line, based on actual data.
References
- [1]
NIST/SEMATECH e-Handbook of Statistical Methods — Control Charts — NIST/SEMATECH
- [2]
Control Chart Basics — American Society for Quality (ASQ)
- [3]