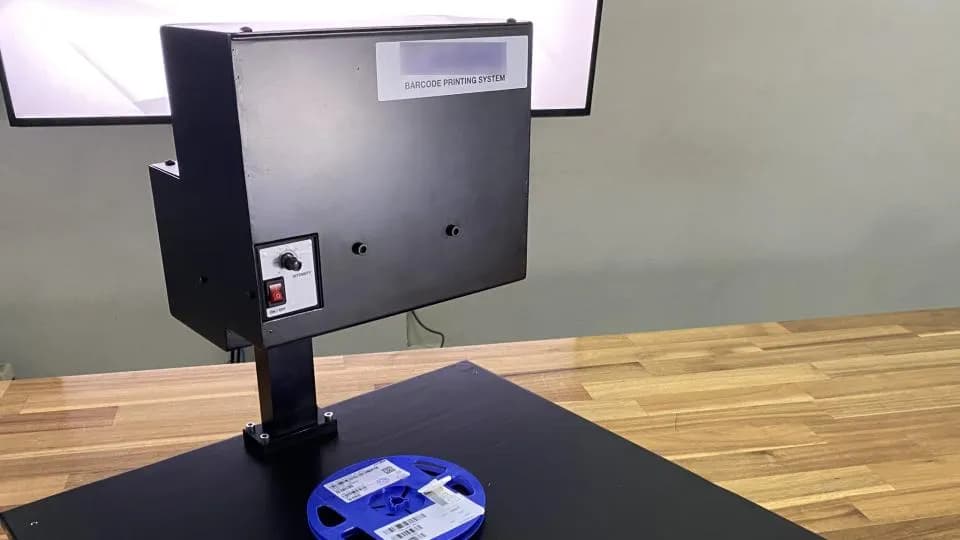





Sensor-based part counting and daily production plan-versus-actual board for an electronics manufacturer
This system counts parts on a conveyor using sensors and compares actual output with interval targets calculated from an Excel production plan, displaying the results on a Production Board via a projector. We designed it for 21 lines at an electronics manufacturer in 2021, built the hardware, and tested 2 sensor types with 2 part types.
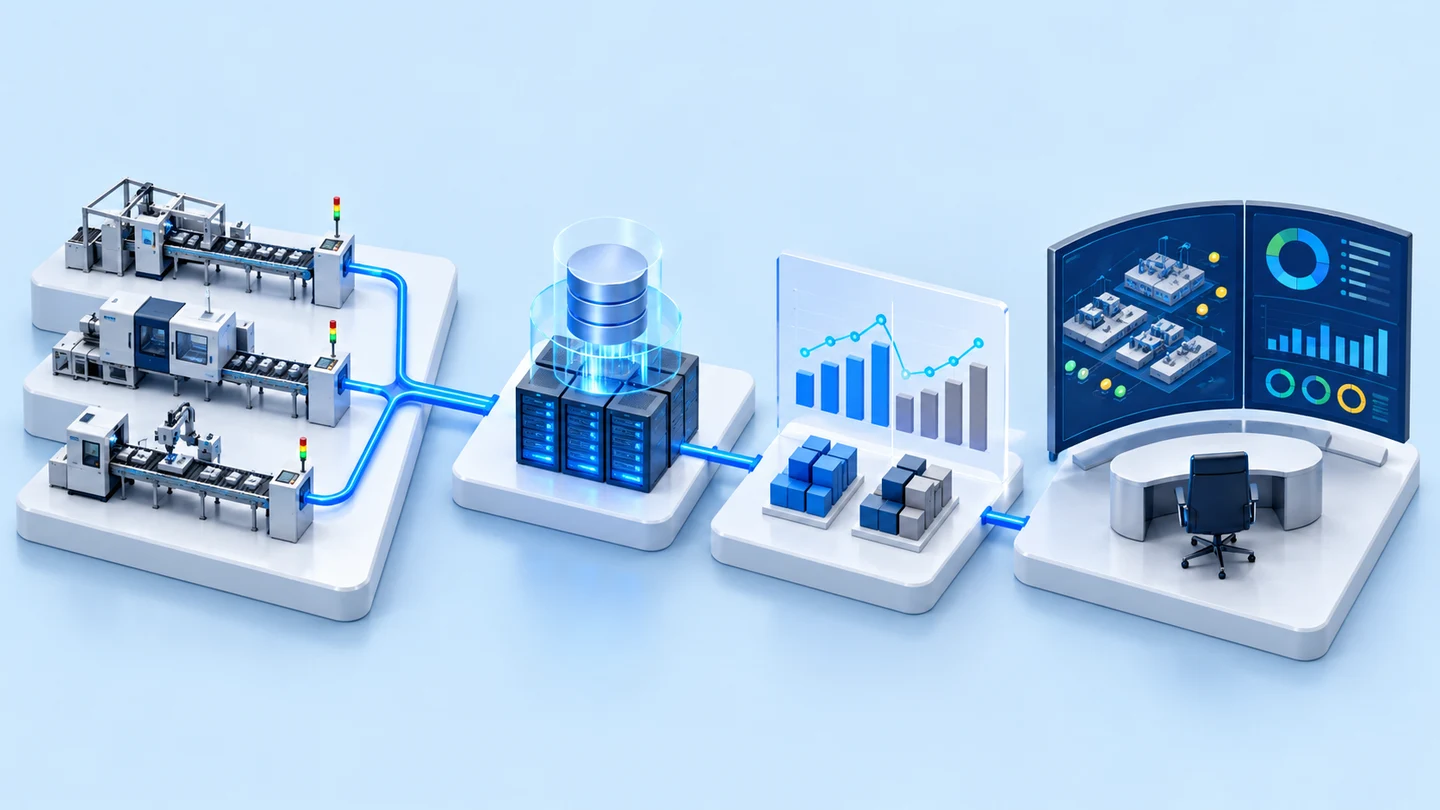
- Production plan from Excel filePlanning department (PC Planning)
- Workpiece counting sensors on the conveyorPhoto Sensor / Image Sensor tested with sample workpieces
- Web applicationCalculates targets from Takt Time
- Production Board via projectorActual output vs plan
- Industry
- Electronics
- Year
- 2021
- Scope of work
- Design of a workpiece counting system on conveyors, supporting 21 lines — web app reads workpiece names and Takt Time from the planning department's Excel production plan file and calculates targets per time period (working time ÷ Takt Time), compared with the sensor count · sensors to count workpieces, with start/stop counting buttons for each line · storage of counts in a database on the server · Production Board via projector showing the plan, actual count and user-entered data · assembly of a workpiece counting hardware set, and testing of a photo sensor versus an image sensor with 2 types of workpiece close in size to the real workpieces · software in Python, PHP, HTML/CSS on Windows 10
Summary
- A prototype sensor-based workpiece counting system that compares actual output with the daily production plan, designed to support 21 lines at an electronics manufacturer in 2021. We built a workpiece counting hardware set and tested 2 types of sensor on 2 types of workpiece.
- The system reads workpiece names and Takt Time from the planning department's Excel file, calculates the target for each time period by dividing working time by Takt Time, then shows actual output against plan on a Production Board via projector.
- In tests with sample workpieces, the photo sensor model tested could not count workpieces with curved edges, because the curved edge made the signal switch on and off repeatedly. We also tested the image sensor on 2 types of sample workpiece.
- The principles from this work are to choose sensors by testing them on real workpiece shapes, and to make clear which data comes from the plan file and which data users enter themselves.
The on-site brief
This electronics manufacturer kept the daily production plans for all 21 lines in the planning department's Excel file, but the quantity actually completed was not yet counted automatically. The brief was to see actual output against target for each time period of the day, using sensors to count workpieces on the conveyor of every line, and to display the results as a Production Board via projector.
What we did
We designed a web application that reads the plan from the Excel file, calculates the target for each time period by dividing working time by Takt Time (the time set for producing one piece), then compares it with the sensor count. We then assembled a workpiece counting hardware set and tested a photo sensor and an image sensor on 2 types of sample workpiece close in size to the real workpieces.
Test results with real workpieces
Test results with sample workpieces: the photo sensor model tested could not count workpieces with curved edges, because the curved edge made the signal switch on and off repeatedly. We also tested the image sensor on the 2 types of sample workpiece. This result applies to that sensor model and that set of workpieces. A real project must be tested again with that factory's own workpieces.
How the brief came about
This system counts workpieces on the conveyor with sensors, then compares actual output with the target for each time period of the day. The brief came from an electronics manufacturer whose daily production plans for all 21 lines were in an Excel file held by the planning department (PC Planning), but whose actual completed quantity was not yet counted automatically.
The brief specified counting workpieces with sensors on the conveyor of every line and displaying the results as a Production Board via projector. In 2021 we designed the system to support all lines, assembled a workpiece counting hardware set and tested sensors on sample workpieces.
System requirements
The system had to use the planning department's existing plan file as its source and be able to count workpieces on the conveyor of every line. The main requirements were as follows.
- Use the planning department's Excel production plan file as the source of the plans for all 21 lines
- Sensors to count workpieces on the conveyor of every line, with buttons for staff to start and stop counting
- Users enter the working time periods and the number of staff on the line themselves
- Store the counts in a database on a server and display the results as a Production Board via projector
- Software as a web application developed with Python, PHP and HTML/CSS, running on Windows 10
How does the system calculate targets and count actual output?
The system calculates the target for each time period by dividing the working time in that period by Takt Time, then compares it with the count from the sensor on the conveyor. This approach uses the plan file the planning department already produces as its source, as the brief required. The system's main job is therefore to count actual output and compare it with the plan.
- 1
Production plan import from Excel files
The system reads the workpiece names and Takt Time for that day from the plan file.
- 2
Sensors count workpieces on the conveyor
When a finished workpiece passes the sensor, the system counts it towards that line's actual output.
- 3
Calculate the target for each time period
The web application works out the target for that time period, then compares it with the actual count in the database.
- 4
Display on the Production Board via projector
The Production Board shows the plan, the actual count and user-entered data via projector.
What is Takt Time?
Takt Time is the time set for producing one piece. Dividing the working time in a period by Takt Time gives the number of pieces that should be produced in that period. The system uses this figure as the target on the board.
What we built and tested
In 2021 we designed the complete system, assembled a workpiece counting hardware set and tested 2 types of sensor on sample workpieces. The items are as follows.
- System design, designed to support 21 lines: input from the Excel production plan file, target calculation from Takt Time, storage of counts in a database on the server, and the Production Board via projector
- Hardware set for testing workpiece counting
- Test results for the photo sensor and image sensor with 2 types of sample workpiece close in size to the real workpieces
- Web application software designed with Python, PHP and HTML/CSS on Windows 10
What were the sensor test results with the sample workpieces?
In testing, the photo sensor model used could not count the sample workpieces with curved edges, because the curved edge made the signal switch on and off repeatedly. We also tested an image sensor on 2 types of sample workpiece.
Scope of the test results
This result comes from a single photo sensor model and a single set of sample workpieces. It is not a conclusion that photo sensors cannot be used with curved-edge workpieces in all cases. Other sensor models or other installation methods must be tested again with real workpieces.
What we learned
This work offers the following principles for workpiece counting and plan vs actual board projects.
- Choose a sensor by testing it on the real workpiece shape, not from the specification alone. In this work, the curved edge of the sample workpiece is what prevented the tested photo sensor model from counting.
- Make clear which data comes from the plan file and which data users enter themselves. In this work, the workpiece names and Takt Time come from the file, while the working time periods and number of staff come from users. With this clear separation, the source of every figure on the board can be checked.
- Test with sample workpieces before planning installation on every line. When the brief covers 21 lines, sensor limitations should surface at the prototype stage, before ordering equipment for every line.
How this approach can apply to your factory
If your factory has its daily production plan in an Excel file and workpieces travel on a conveyor, you can use the same structure as this case: read the plan from the file, calculate targets from Takt Time, count actual output with sensors, then show them side by side on a board. The part that needs the most adjustment is the sensor type, which must be tested with your real workpieces.
Reusable parts and parts that need adapting
| System part | Reusable | Needs adapting when |
|---|---|---|
| Production plan | Reading workpiece names and Takt Time from an Excel file | Your plan file has a different format from this case, or the position of data in the file changes often |
| Target calculation | Working time in each period divided by Takt Time | Your factory sets targets another way, so the formula must be agreed first |
| Actual count | Sensors on the conveyor, with buttons to start and stop counting | Your workpieces have a different shape from this case, so the sensor must be tested with real workpieces before choosing a model; or the line has no conveyor, so a different counting point must be chosen |
| Visualisation | Production Board on a web application | You want to show additional data, so you must define whether it comes from the plan file, sensors or user entry |
Beyond the items in the table, you should plan sensor and cable installation according to the line layout, together with the times when the line can be stopped.
Start with one pilot line
Install the sensors and board on one line first, to confirm that workpieces are counted correctly and the screen is easy to read, then expand to other lines.
Read more
Technology used
Frequently Asked Questions
What does the factory need to prepare?
A system like this needs an Excel production plan file containing workpiece names and Takt Time, the working time periods and number of staff on the line entered by users, sensor mounting points on the conveyor, a server for the database, a projector for the Production Board, and sample workpieces for testing sensors before choosing a model.
How does the system know how many pieces should be produced in each time period?
The system takes Takt Time from the production plan file, then calculates the target for each time period by dividing working time by Takt Time. It then compares this with the count from the sensor.
Can a photo sensor count workpieces with curved edges?
In the tests for this case, the photo sensor model tested could not count the sample workpieces, because the curved edge made the signal switch on and off repeatedly. This result applies only to that sensor model and that set of workpieces. You should test sensors with your real workpieces before choosing one.
If a line has no conveyor, can this approach be used?
The plan reading and target calculation parts can be used as they are, but you need to choose a different point for counting actual output, such as a push button at the workstation, which we have done in the push-button production count case. You should survey the actual line before choosing a counting method.
Is there an option if I want a ready-to-use plan vs actual board?
Yes. DoLINE is a production target board on an Android screen, showing Plan / Actual / Diff at the line (see the DoLINE product page for details). For work that needs to connect sensors or a factory-specific plan file, please request a quotation.