




Production counter system with button press, featuring a comparison display of actual production figures at 7 stations for Thai manufacturing plants
This production counter system allows employees to press a counting button (Hand Switch) after completing each piece of production, then displays the plan (Plan), actual (Actual), and difference (Diff) figures for each station over time on the machine screen. The supervisor can view the total daily count from the Server Dashboard (Summary screen on the server). We developed this system for Thai manufacturing plants in B.E. 2567 for 7 production stations.
- Industry
- General manufacturing
- Year
- 2024
- Scope of work
- Design and development of a production count system: Station Dashboard for 7 stations (day and night shifts, up to 10 time slots per shift), 1 Server Dashboard set on 1 Server machine on the line, with a Web Application (a program viewed through a web browser) and an SQL database (a system that stores data in tables), and configuration through nimitFlow Lite. Supply of 7 sets of processing boards with power adapters, testing against the acceptance checklist, and preparation of user manual version 1.0. On-site installation is not included.
- Duration
- About 2 months (Aug–Sep 2024)
Summary
- This production count system uses a Hand Switch button that the operator presses when each piece is finished, instead of having people count output at the end. It covers 7 workstations.
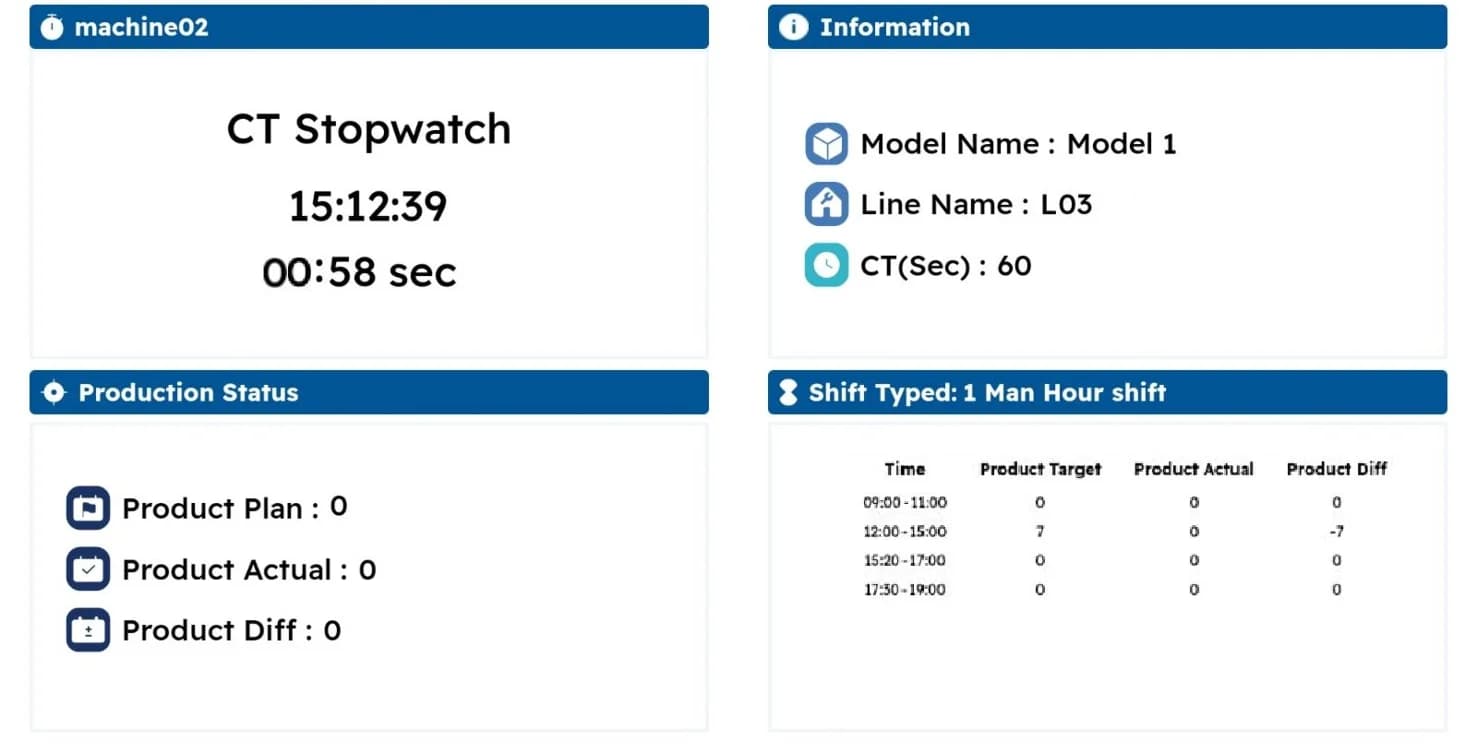
- The Station Dashboard display at each station calculates the plan (Plan) from the Cycle Time of the model being produced, then shows it alongside the actual count (Actual) and the difference (Diff) for every time slot, with up to 10 time slots per shift.
- All 7 stations send data through a Wi-Fi Access Point (a point that distributes the Wi-Fi signal) to 1 Server machine on the line. The system runs on the internal network without needing internet access.
- We delivered the full 7 sets of processing boards with power adapters in August 2024 and tested the system against the acceptance checklist in September 2024.
- All plan values come from the model and Cycle Time table that the administrator sets in a CSV file through nimitFlow Lite, so this data must match actual site conditions before use begins.
The on-site brief
The factory previously relied on people counting production output at the end, which could lead to counting errors. This line produces several models, and each model has a different production time per piece (Cycle Time). The customer therefore wanted a system that shows plan against actual count for each station by time slot, separated into day and night shifts.
What we did
We developed a system in which each station has a Hand Switch button, a processing board (Embedded Processor) and a Station Dashboard display, which calculates the plan from the Cycle Time of the model being produced and shows it alongside the actual count and the difference. All stations send data over Wi-Fi to a Server machine on the line, which runs on the internal network without needing internet access. Administrators configure models and working time slots with a CSV file (a tabular data file) through nimitFlow Lite.
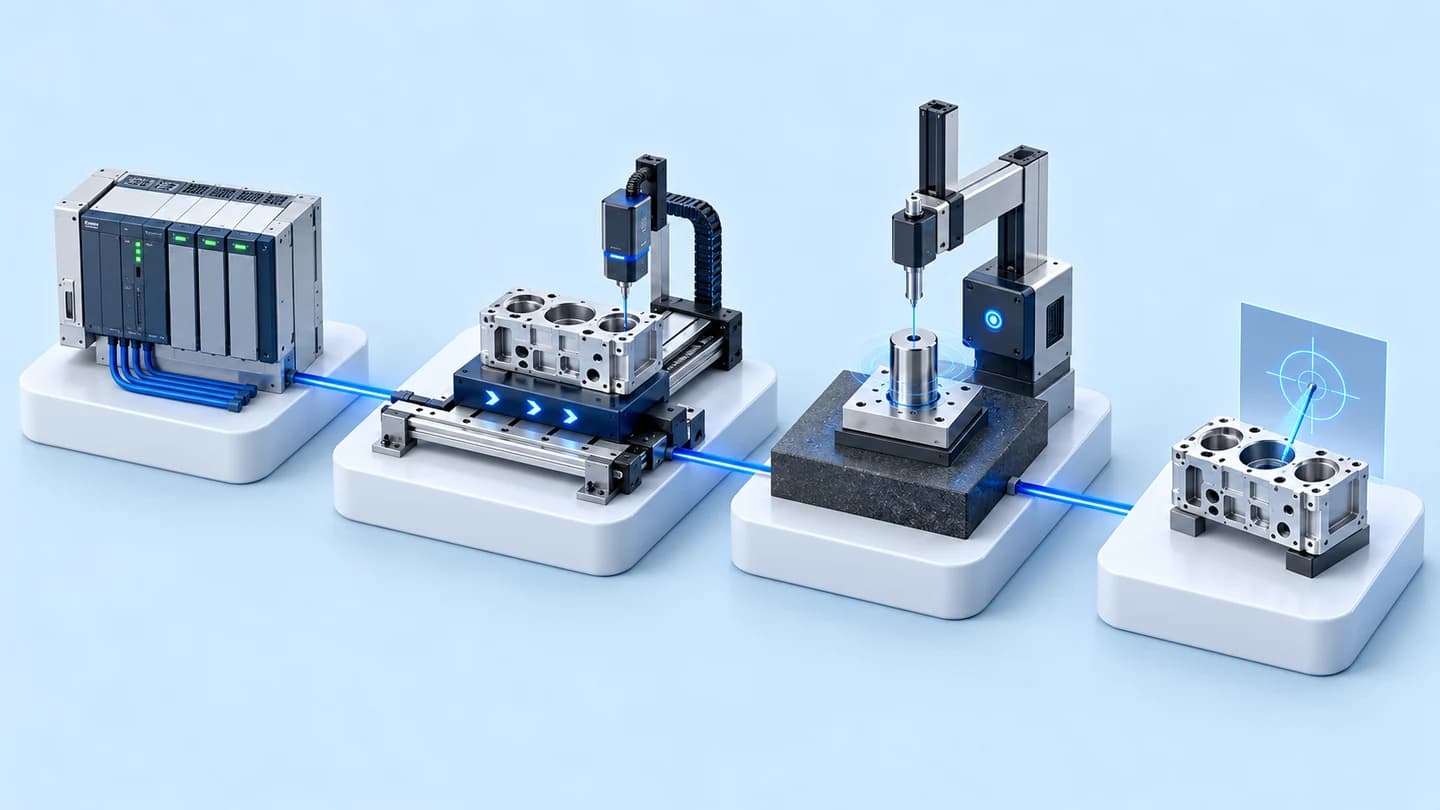
- Hand Switch push button7 workstations
- Processing board + Station DashboardPlan / Actual / Diff
- Wi-Fi Access Point
- Server + SQL database
- Server DashboardDaily totals + graphs
Results
We delivered the full 7 sets of processing boards with power adapters in August 2024 and tested the system against the acceptance checklist (Exit Criteria), covering the configuration, Station Dashboard and Server Dashboard parts, in September 2024. User manual version 1.0 was prepared in October 2024.
Measured results
- Workstations supplied with a processing board and adapter
- 7stations
How the brief came about
The goal in this case was to see each station's plan against actual count during the shift, rather than waiting for figures from a count at the end. The scope of work agreed with the customer required the system to run offline, meaning it works on its own on a machine on the line without connecting to an external network.
Because each model takes a different time to produce, the plan for each time slot changes with the model being produced. The customer therefore wanted a system that calculates the plan according to the model and shows results separately for day and night shifts.
What is Cycle Time?
Cycle Time is the standard time taken to produce one piece of a given model. This system uses Cycle Time to set the pace of the plan. When the actual count entered by button press falls behind the plan, the difference on the display shows how many pieces short it is.
Requirements and constraints
The system must count output with push buttons at the workstations and must work on the line's internal network. The main requirements and constraints are as follows.
- Count actual output with a Hand Switch button that the operator presses when each piece is finished, covering 7 workstations
- Calculate the plan from the Cycle Time of the model being produced, and show the time, plan, actual count and difference for each time slot
- Separate day and night shifts, with up to 10 time slots per shift
- A summary page of totals across all stations for supervisors
- Run on the internal network, on 1 Server machine on the line, without needing internet access
- On-site installation is outside our scope
How the system calculates the plan and counts actual output at each station
The Station Dashboard display at each station counts down according to the Cycle Time of the model being produced. Each time a cycle completes, the plan increases by one piece. The actual count increases each time the operator presses the Hand Switch button. The system can therefore calculate the difference for each time slot immediately, and nobody has to work out the plan by hand when the model changes.
We chose to calculate the plan from Cycle Time because this line produces several models with different times per piece. When the model or working time changes, the administrator edits the CSV file and uploads it through nimitFlow Lite. The workflow is as follows.
- 1
Set models and working time slots
The administrator enters the line name, model names, the Cycle Time of each model and the stations in use into a CSV file, sets the working time slots for the day and night shifts, then uploads it through nimitFlow Lite to send the values to all stations.
- 2
Station display calculates the plan
When a working time slot begins, the Station Dashboard display counts down according to the Cycle Time of the model being produced. Each time a cycle completes, the plan increases by one piece and a new cycle count begins.
- 3
Operator presses the button when a piece is finished
Each time one piece is finished, the operator presses the Hand Switch button. The actual count on the display increases, and the system immediately calculates the difference against the plan for that time slot.
- 4
View the time-slot table at the machine
Each station's display shows the model name, line name, Cycle Time, the station's enabled/disabled status (Online/Offline) and a table of time, plan, actual count and difference for each time slot in the shift.
- 5
Summarise totals on the Server Dashboard
The supervisor selects a date to view the total plan, actual count and difference across all stations by line and model, and selects a model to view a graph of each station's production output by time slot. The view can be switched between day and night shifts.
Deliverables
We delivered the production count system software with 7 sets of processing boards. This work took about 2 months, from August to September 2024.
- Station Dashboard for 7 stations: display of plan, actual count and difference, with a time-slot table for each station
- 1 Server Dashboard set: a Web Application (a program viewed through a web browser) with an SQL database (a system that stores data in tables) on a Server machine on the line, summarising totals by line and model, with time-slot graphs
- Configuration through nimitFlow Lite: CSV files for models, Cycle Time, stations in use and working time slots
- Processing boards (Embedded Processor) with power adapters, 7 sets for 7 workstations
- Testing against the acceptance checklist (Exit Criteria)
Results confirmed from the delivery documents
The confirmed results of this case are the delivery and the testing as documented. We delivered the full 7 sets of processing boards with power adapters in August 2024 and tested the system against the acceptance checklist, covering the configuration, Station Dashboard and Server Dashboard parts, in September 2024.
User manual version 1.0 was prepared in October 2024. The delivered system is designed so that supervisors can see actual count against plan for each station during the shift. This case has no production performance figures from after use began, so we report only results backed by documents.
What we learned
This work offers principles for production count systems and line-side plan vs actual displays.
- The plan on the display is only as reliable as its input data. When the plan is calculated from Cycle Time, the model table, Cycle Time and working time slots of each shift must match actual site conditions before use begins. If these figures are wrong, the difference on the display will be wrong too.
- Model changes need an agreed procedure. This system does not clear counts already recorded when settings change, so the administrator should update the configuration before a working time slot starts and reopen the program at the station, so that counts from the old and new configurations do not mix.
- The scope of installation work must be clear from the start. When on-site installation is out of scope, who prepares the board power supply and the Wi-Fi signal at each station must be agreed in advance, because every station must be able to send data to the Server machine.
How can this approach be applied to your production line?
If your line still counts output manually and produces several models with different Cycle Times, you can use the same approach as this case: count actual output with push buttons, calculate the plan from Cycle Time, then show the difference by time slot at the machine. What needs adapting depends on your line's count input method, model table, shifts, summary page and network, as shown in this table.
Reusable parts and parts that need adapting
| System part | Reusable | Needs adapting when |
|---|---|---|
| Actual output input | Counting with a Hand Switch button at the workstation | You want to take counts from machine signals or sensors instead of button presses. The signal pick-up points on the machine must be surveyed first. |
| Plan calculation | Countdown based on Cycle Time and the time-slot table | Your models and Cycle Times differ from this case. A new model table must be prepared. |
| Shifts and time slots | Separate day and night shifts | Your line runs more shifts than this, or has more than 10 working time slots per shift. A new format must be agreed. |
| Summary page | Server Dashboard summarising by line and model | You want to combine several lines or pass data on to other systems. An additional integration part must be designed. |
| Network | Operation on the internal network without internet | The Wi-Fi signal does not reach some stations. Access points must be positioned before installation. |
- Prepare the list of models and the Cycle Time of each model so that they match actual site conditions
- Clearly define the working time slots and break times of each shift
- Check the installation point of each station, including the board power supply and the Wi-Fi signal reaching the Server machine
- Agree the scope of on-site installation work separately and clearly
Read more
- DoLINE: production line tracking system on a tablet or Android display at the line
- nimitFlow: Low-Code platform for building Workflows and connecting data
- Custom system development service
- Case of a prototype daily plan vs output board that counts workpieces with sensors
- Case of supplying PLC sets and network switches for Tower Lamp work on a packaging line
- Step-by-step configuration instructions for the DoLINE Target Board
Technology used
Frequently Asked Questions
How does the system count production? Does it need cameras or sensors?
In this case, no cameras or sensors are used. The operator presses the Hand Switch button each time one piece is finished. The station's processing board counts this as the actual count (Actual) and shows it on the Station Dashboard display immediately.
What is the plan value (Plan) on the display calculated from?
The plan value is calculated from the Cycle Time of the model being produced. When a set working time slot begins, the display counts down according to Cycle Time. Each time a cycle completes, the plan increases by one piece, and the system then calculates the difference (Diff) between the actual count and the plan for each time slot.
Does it need an internet connection?
No. All 7 stations send data through a Wi-Fi Access Point (a point that distributes the Wi-Fi signal) to 1 Server machine on the line, which has the Web Application and SQL database installed and runs on the factory's internal network.
How can the model being produced or the working time slots be changed?
The administrator edits the model configuration file and the line configuration file (CSV), uploads them through nimitFlow Lite to send the values to all stations, then reopens the program at the station. Changes should be made before a working time slot starts, because the system does not clear counts already recorded.
If I want a system like this, how much does it cost?
There is no fixed price. The price depends on the number of stations, the equipment and the on-site installation work. Please contact us to request a quotation. We will assess the number of models, the Cycle Time and the line's work shifts before proposing an approach.