




Central database and KPI dashboard web app on Google Cloud for an automotive parts manufacturer in Thailand
Customer: Automotive parts manufacturer (Japanese conglomerate)
This central database web app on the customer's Google Cloud Platform (GCP) consolidates multiple reports and displays internal losses, rejects, output, sales and profit KPIs on one website. We developed it for an automotive parts manufacturer in Thailand, delivered the first phase in 2023, and extended it with modules for other departments through early 2024.
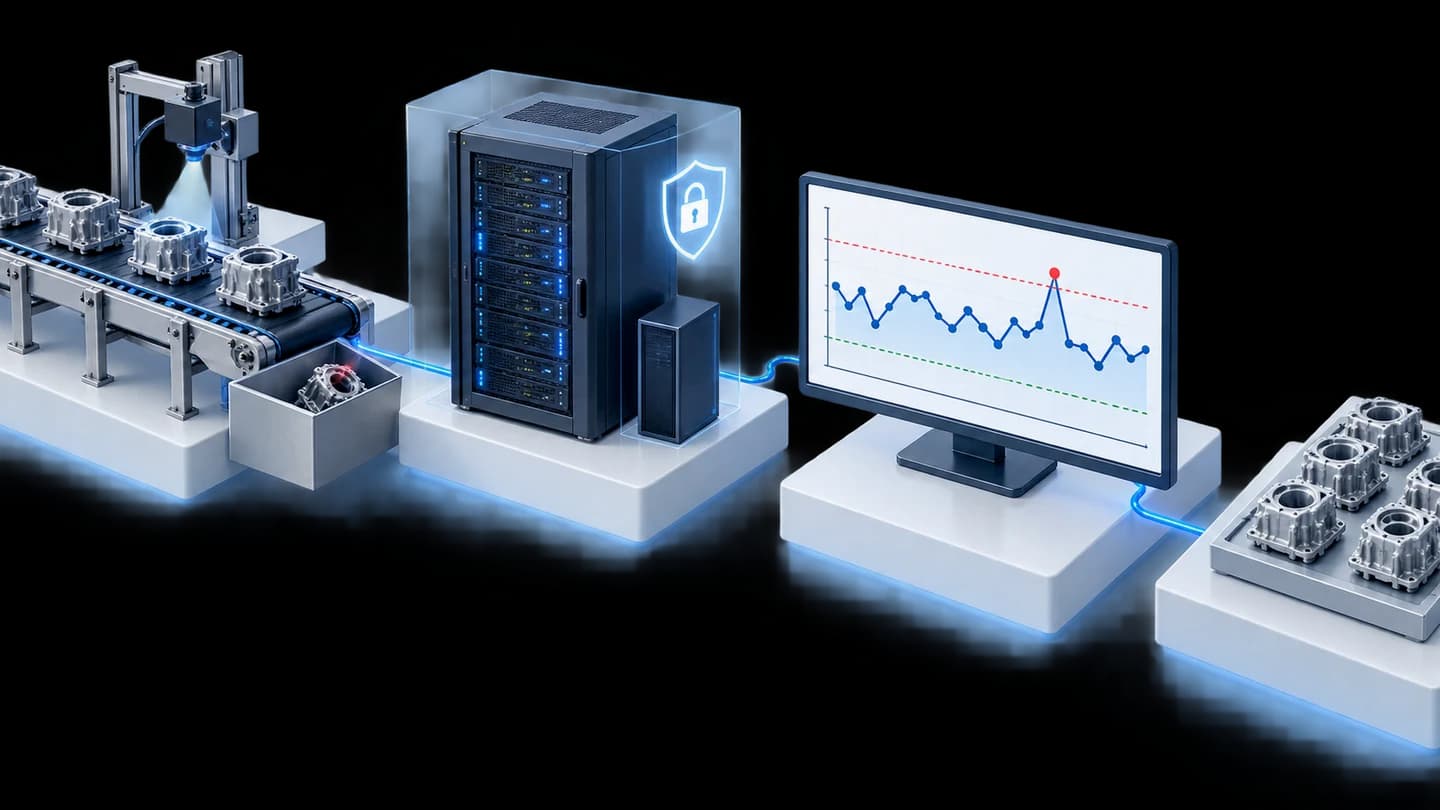
- Excel reports + site dataUploaded or entered through the web
- Central database web appOn the customer's GCP
- Cloud SQL + GCSStores data and files
- KPI dashboardDefects, sales, profit; claims still being revised
- Security layerCloud Armor (WAF), SSL, Log
- Industry
- Automotive
- Year
- 2023–2024
- Scope of work
- Design and development of a central database web app on the customer's GCP. The first phase in 2023 covered the overview page, internal loss KPIs, defect records, hourly output, plan-versus-actual output comparison by shift, and master data, along with a user manual and system administration documents. Follow-on work in 2023–2024 comprised revising the internal loss module, a sales and profit module, cloud security work and a customer claims module.
Summary
- A central database web app for an automotive parts manufacturer in Thailand consolidates data from several sets of report files into a single database on the customer's own Google Cloud Platform (GCP).
- The first phase automatically calculates the value of defects from the production process (Internal Loss) and the defect rate, with pages for defect recording, hourly output and plan-versus-actual output comparison by shift.
- The customer's representative signed the first phase's acceptance checklist in July 2023 and the delivery note in August 2023.
- Follow-on work in the same system comprises a sales and profit module, cloud security work following the customer's checklist, and a customer claims module that was still being revised and having its data checked in early 2024.
- Principles drawn from this work: agree the source file format before development, check uploaded data against the source reports, and include security requirements in the scope from the start.
The on-site brief
The data executives use to monitor the factory, such as the value of defects from the production process (Internal Loss), production volume, sales, profit and customer claims, sat in several sets of report files from multiple systems. The customer wanted to consolidate this data in a single database on the company's GCP while reducing the server maintenance burden, and the system had to pass the security checklist of the customer's IT department.
What we did
We developed a web app on GCP that takes in the existing Excel report files and on-site data entered through the web, then calculates and displays KPIs automatically. Data is stored in Cloud SQL (PostgreSQL) and files in Google Cloud Storage (GCS). We began with a first phase focused on internal loss and defects, then added other departments' modules to the same system one part at a time.
Results
The first phase was delivered in 2023, and the customer's representative has signed the acceptance checklist and the delivery note. Our status summary at the end of 2023 states that the internal loss, security, and sales and profit modules were completed, while the customer claims module was still being revised and having its data checked in early 2024.
How the brief came about
The customer wanted to consolidate internal organisational data in a single database on the company's GCP and view KPIs across several areas from one website. Before the work began, each area's data sat in separate sets of report files from multiple systems.
The customer wanted staff to use the same website both to enter on-site data and to view dashboards. The first phase therefore began with internal loss and defect KPIs, before adding data from other departments to the same system.
What is Internal Loss?
Internal Loss is the value of defects arising within the production process. In this system it is calculated from the uploaded defect report files and production volume files, then displayed by product group and time period to show where the losses come from.
Requirements and constraints
The system had to run on the customer's Google Cloud Platform (GCP) and meet the requirements of the customer's IT department. The main requirements and constraints are as follows.
- Store data on the customer company's GCP, under the organisation's account and policies.
- Keep the server maintenance burden to a minimum, so the system is built mainly on serverless cloud services (the cloud provider looks after the servers).
- Users still produce the same Excel report files and enter some on-site data through web pages.
- Systems going onto the cloud must pass the security checklist of the customer's IT department and require approval before every deployment.
- At the start of the first phase, the input and output file formats were not ready, and requirements changed during development.
How does this central database system work?
This system takes existing report files into a single database, then calculates KPIs and displays them as charts and tables in a web browser. We chose to accept files in their existing format because most of the data was already in those report files. The web entry pages are therefore open only for on-site data not yet in the reports.
The customer also wanted to reduce server maintenance work, so the system uses services managed by GCP, such as Cloud Run and Cloud SQL, to reduce server upkeep. The system works through the following steps.
- 1
Bring data into the system
Users upload Excel report files and corrective plan files (PDF) through the upload page. On-site data, such as defect quantities and hourly output for each Part No. (part code), is entered through the Defect Record Sheet and Production Today pages.
- 2
Calculate KPIs automatically
The Overall Summary page calculates Internal Loss and the defect rate for the selected period: daily, weekly, monthly or yearly. The Business KPI Internal Loss page shows charts by product group, the monetary value lost, and the target line set on the KPI target-setting page.
- 3
See which defects to fix first
The defect dashboard ranks the most frequent defects and lets responsible staff enter the cause, corrective approach and due date for the top-ranked items. Users can click a point on a chart to open the attached PDF file.
- 4
Compare plan with actual output
The Performance Analysis page calculates the production plan from the production cycle times set on the Master Data page, then compares it with the actual output entered, by shift, along with a record of problems that caused lost time.
- 5
Control security according to the customer's checklist
Cloud security work covers the Cloud Armor web application firewall (WAF), SSL encryption, the ClamAV antivirus program, password rules, restricted administrator privileges, access and activity logs, database backups, and separate GCP environments for development and production.
Deliverables
We delivered the first-phase web app on the customer's GCP in 2023, along with a user manual and system administration documents. The main pages of the first phase are as follows.
- Overview page (Overall Summary): Internal Loss and defect rate by time period
- Upload page for Excel report files and corrective plan files (PDF)
- KPI target-setting page and Business KPI Internal Loss page by product group
- Defect record entry page and dashboard (Defect Record Sheet)
- Hourly output entry page (Production Today) and plan-versus-actual output comparison page by shift (Performance Analysis)
- Master Data page and user login page
How did this system expand from the first phase into several modules?
We expanded this system by adding each department's module to the same web app and database one part at a time. Each module has its own scope and requirements document. The security work added separate GCP environments for development and production, and an approval step before deployment, so that new modules can be tested before going onto the live system. The sequence of work is as follows.
- 2023, first phase: internal loss KPIs, defects, output and master data; delivered, with acceptance signed
- 2023, internal loss module revision: attaching PDF files in tables, uploading files from the table page, and checking uploaded data against defect reports and production volume reports, with alerts on the upload page
- 2023, sales and profit module: Sales Dashboard (plan, actual and variance), Profit Dashboard and Forecast, with pages for uploading and exporting data by template
- 2023, cloud security work following the checklist of the customer's IT department
- 2023–2024, quality module: customer claims and complaints, market claims, and email settings; in a round of revision and data accuracy checking in early 2024
The same customer's expense module is a separate case. Read the details in the case on a web app tracking actual expenses against targets by department
Confirmed results from the acceptance documents
The confirmed results of this case are that the first phase has been delivered and that there are acceptance documents signed by the customer's representative. For modules added later, there is only our own project status summary. Each document confirms different things, as follows.
- Acceptance checklist (Exit Criteria Checklist) for the first phase: signed by the customer's representative, the responsible reviewer and our signatory in July 2023
- Delivery note: the customer's representative signed to accept the first-phase system in August 2023
- First-phase closing document: lists the user manual, system administration documents and the signed acceptance checklist among the deliverables
- Our project status summary at the end of 2023: an internal document of ours, not a customer acceptance document, and the only source stating the status of the follow-on modules
The modules added after the first phase do not yet have signed acceptance documents, so we do not describe them as having passed acceptance. Additional corrections after first-phase acceptance had a separate retest round. This case has no business performance figures, so we report only the results backed by documents.
What we learned
This work offers the following principles for central database projects that take data from report files.
- Agree the source file format before development. A system that reads report files reads values according to the file structure. In this project, the input and output file formats were not ready at the start and changed during development, so the next project should lock down the columns, codes and KPI formulas with the owners of the figures, along with real sample files, before starting to build the system.
- A system that accepts uploaded files must check the data against the source reports. In this project, the scope of the internal loss module revision included checking data against defect reports and production volume reports, with alerts on the upload page, because a dashboard can be used for decisions only when its figures match the reports each department already uses.
- The IT department's security requirements are part of a cloud system, not an add-on for later. A system going onto an organisation's cloud must answer the checklist, configure firewalls, keep usage logs and have an approval step before deployment, so these should be included in the scope of work from the start.
How this approach can apply to your work
If your organisation has KPI reports across several areas in multiple sets of Excel files and already has a company cloud account, you can use the same approach as this case: take existing report files into a central database, calculate KPIs and display them on one website. This approach suits situations where each department keeps its figures in its own files and seeing the overall picture has to wait for someone to compile the reports. The parts that need adapting are your organisation's file formats, KPI formulas and security requirements.
Reusable parts and parts that need adapting
| System part | Reusable | Needs adapting when |
|---|---|---|
| Data intake | Excel report file upload and on-site data entry pages | Your report files have columns and codes that differ from this case; the file structure must be redefined. |
| KPI calculation | Calculation by time period, target setting and breakdown by product group | Your formulas or target-passing criteria differ; these must first be agreed with the owners of the figures. |
| Data checking | Comparing uploaded data with source reports and alerting on the upload page | The reports used for comparison differ from this case; the report pairs used for checking must be redefined. |
| Cloud infrastructure | Cloud Run, Cloud SQL and GCS on the customer's GCP | Your organisation uses a different cloud provider or needs on-premise installation; this part must be redesigned. |
| Security | Separation of development and production systems, and an approval step before deployment | Your IT department's checklist has different requirements, so the configuration must follow that checklist. |
- Prepare real sample report files for every set, and confirm how long the file format can be kept unchanged.
- Agree the KPI formulas and the green/red thresholds with the owner of the figures in each department before development.
- Request the IT department's security checklist from the start and include it in the scope of work.
- Start with the module whose data is most ready, then allow for revision rounds based on user feedback in each module.
Price and timeframe
Work of this kind has no standard price. It depends on the number of modules, the number of source files and each organisation's security requirements. Please contact our team to request a quotation after a requirements survey.
Read more
- Custom system development service
- Data management and integration services
- Data Lakehouse: consolidating data from multiple sources in one place
- Case: Web app tracking actual expenses against targets by department on Google Cloud
- Case: Consolidating production data from multiple lines on a central server
- Case: P-Chart Control web app on an in-factory server
- Article: How to choose between On-Premise and cloud for storing factory data
Technology used
Frequently Asked Questions
Where is this system's data stored?
The system is installed on the customer's own Google Cloud Platform (GCP). Data is stored in Cloud SQL (PostgreSQL) and uploaded files are stored in Google Cloud Storage (GCS), so the data remains under the customer company's account and policies.
Do we have to change how we currently produce reports?
In this case, not everything has to change. Users upload the same set of Excel report files to the system, while data not yet in the reports, such as defects and hourly output, is entered through a web page, and the system then calculates the KPIs. What needs to be agreed is the file format to be retained.
How does the system meet the IT department's security requirements?
In this case, the security work followed the checklist of the customer's IT department, for example the Cloud Armor web application firewall (WAF), SSL encryption, ClamAV antivirus software, password rules, restricted administrator privileges, access and activity logs, database backups, and separation of the development and production systems.
Can modules be added later?
Yes. This case began with a first phase focused on internal loss and defect KPIs, then added sales and profit modules, security work and a customer claims module to the same system, one part at a time. The scope and price of each module must be assessed from the organisation's actual data.
Has this system been delivered?
The first phase was delivered in 2023, with the customer's representative signing the acceptance checklist and the delivery note. The modules added later had further revision rounds based on user feedback, and the customer claims module was still being revised and having its data accuracy checked in early 2024.