




AI software for classifying VOC patterns from breath, with a prototype gas sensor box, for research by a government environmental agency in Thailand
Organisation: Department of Environmental Quality Promotion
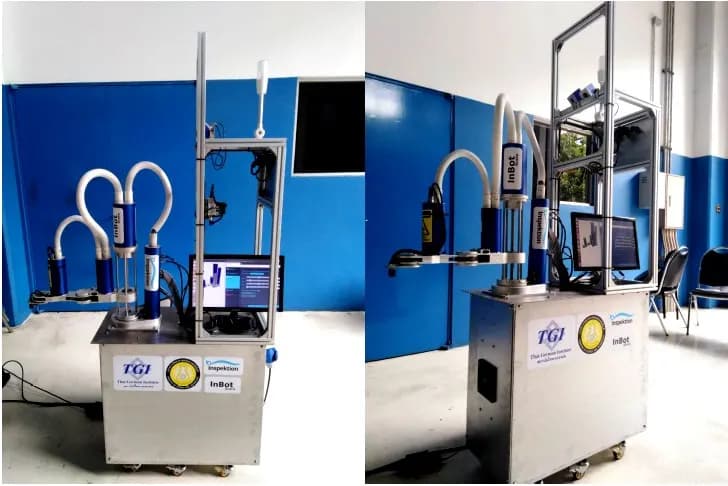
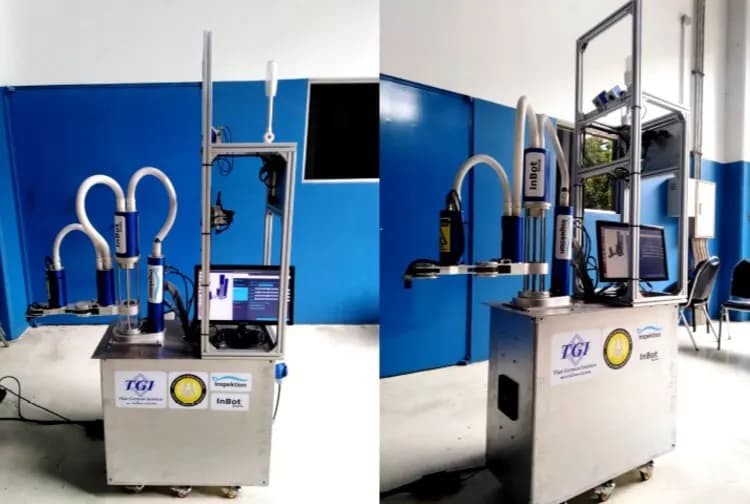
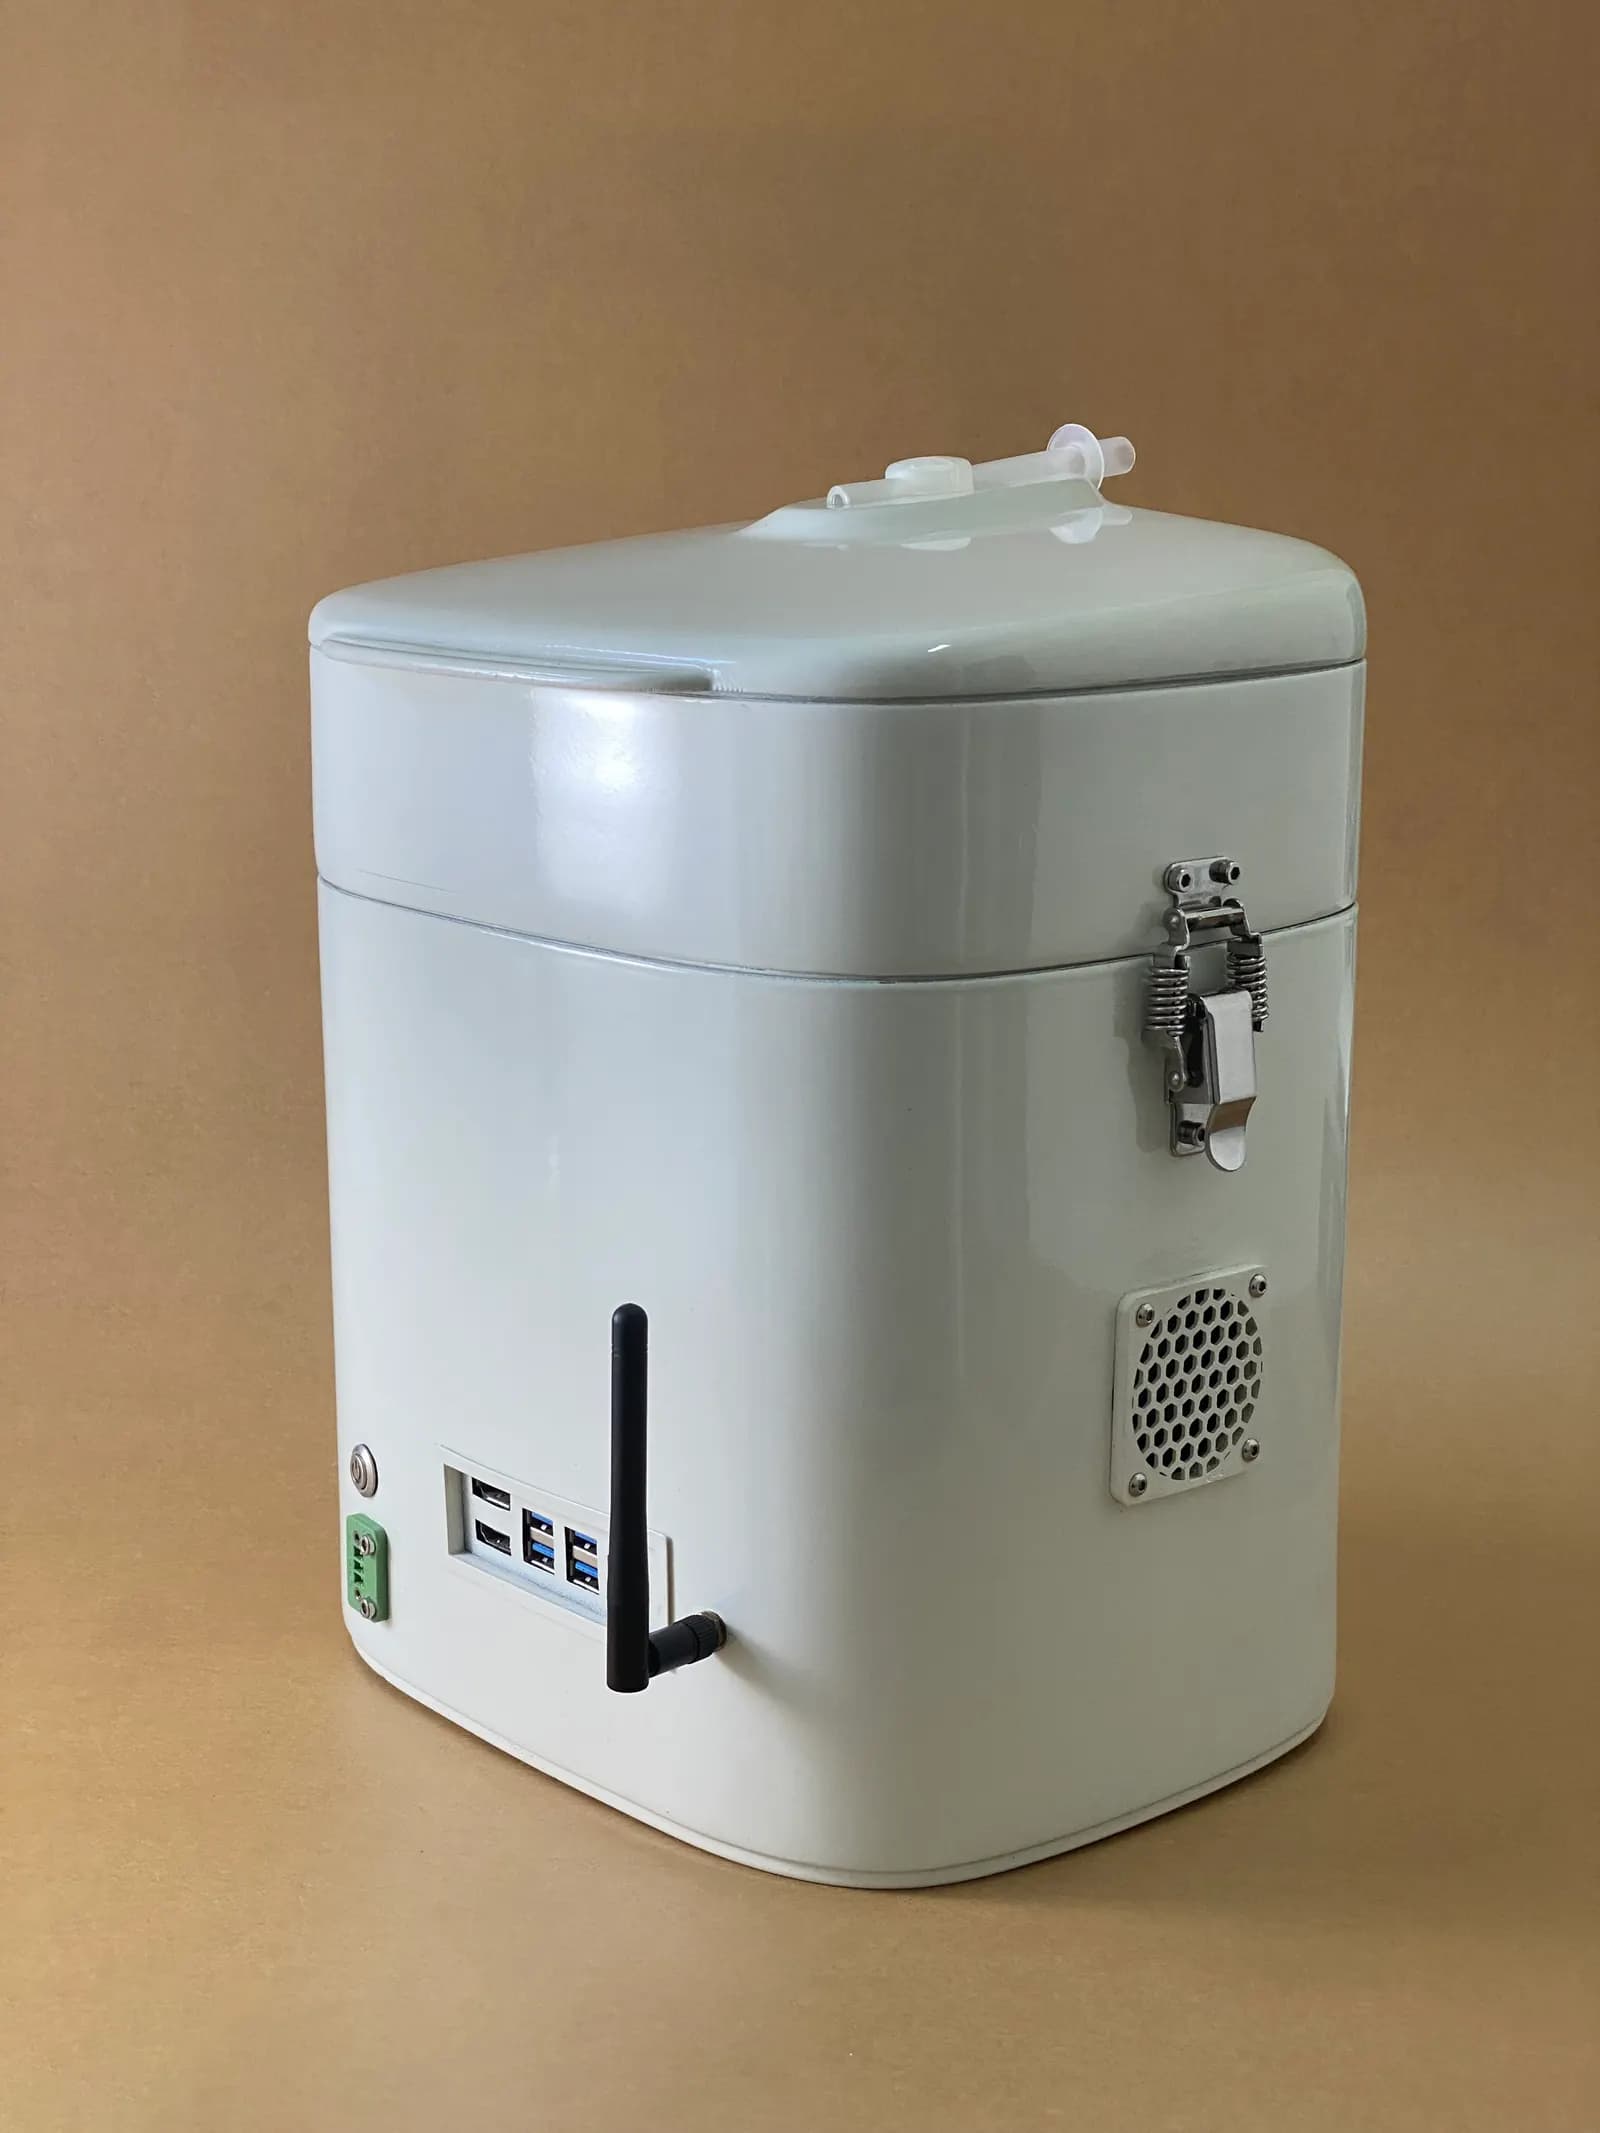
We developed software for collecting data and classifying VOC (volatile organic compound) patterns from breath using an SVM AI model, along with a prototype gas sensor box with 10 sensors, for research by the Department of Environmental Quality Promotion in 2019–2020. This system is a research tool, not a medical device for diagnosing disease.
- Industry
- Government
- Year
- 2019–2020
- Scope of work
- Algorithm and software for classifying VOC patterns from breath, 1 job, under the terms of reference of the Environmental Research and Training Centre, comprising a sensor reading circuit board, a prototype gas sensor box with 10 sensors for testing with volunteers, the Data Collector program, a web application and a user manual, plus additional work to build an air chamber and to calibrate the sensors against standard VOC gas mixtures at 5, 10 and 25 ppb (parts per billion) using linear regression.
- Duration
- Jul 2019 – Apr 2020
Summary
- We developed software for classifying VOC patterns from breath using an SVM AI model, along with a prototype gas sensor box with 10 sensors, for research by the Department of Environmental Quality Promotion in 2019–2020.
- The Data Collector program holds data on the local machine before sending it to the online database one person at a time or as a complete batch, so data collection can continue even without internet access.
- The web application displays values as numbers and graphs, is used to create or import SVM AI models, and shows predictions as probability values.
- In November 2019 we demonstrated the device and program to the client and handed over the user manual. We later added an air chamber and calibrated the sensors against standard VOC gas mixtures at 5, 10 and 25 ppb.
- When the project closed in 2020, the software was complete, while the circuit still needed adjustment to read all the sensors.
The on-site brief
The Environmental Research and Training Centre of the Department of Environmental Quality Promotion needed a tool to collect VOC data from breath and classify the patterns of 3 groups of volunteers: healthy people, cancer patients and patients with other diseases. The terms of reference specified that results be displayed as numbers and graphs, and that data collection and report viewing be possible on computers, mobile phones and tablets.
What we did
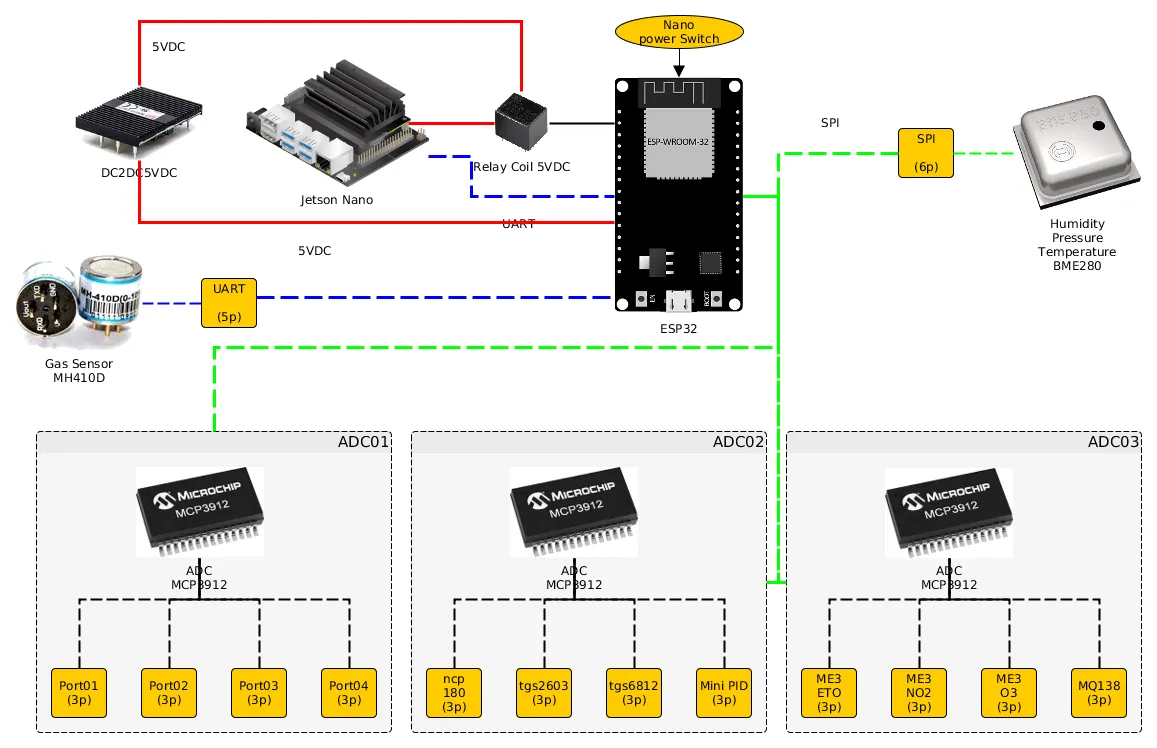
We worked with the project's main contractor, developing the sensor reading circuit board, assembling a gas sensor box with 10 sensors and writing the Data Collector program, which holds data on the local machine before sending it to an online database. The web application is used to create or import SVM (Support Vector Machine) AI models and shows predictions as numbers and graphs. Work added later was an air chamber inside the box and calibration of the sensors against standard gases.
- Gas sensor box10 sensors + air chamber
- Sensor reading circuit board
- Data CollectorHolds data locally, then sends it online
- SVM AI modelCreate or import models
- Web applicationNumbers, graphs, predictions
Results
In November 2019 we demonstrated the device and program to representatives of the main contractor and the Department of Environmental Quality Promotion, and handed over the user manual. In 2020 we calibrated the sensors and prepared a results report. When the project closed, our annual records stated that the software was complete, while the circuit still needed adjustment to read all the sensors.
How the brief came about
The brief for this case was a tool to collect and classify VOC patterns from volunteers' breath, for research by the Environmental Research and Training Centre, Department of Environmental Quality Promotion. The centre had received a 2019 budget to study devices for measuring VOCs from breath. The research team needed an algorithm and software to distinguish the patterns of 3 groups of volunteers: healthy people, cancer patients and patients with other diseases.
We did this work with the project's main contractor, an engineering company. Our part was the sensor reading circuit board, the prototype gas sensor box and the software for collecting data, building models and displaying results.
What are VOCs?
VOCs (volatile organic compounds) are substances that evaporate into vapour at room temperature. The terms of reference for this work state that cancer cells release specific VOCs through breath, so the research needed a tool to collect and classify VOC patterns from volunteers' breath.
Requirements and constraints
The system had to collect breath data from volunteers in every group and let researchers build models from that data. The terms of reference and project requirements specified that the system must do the following.
- Receive breath blown by volunteers into a gas sensor box with 10 sensors, then read values from every sensor.
- Classify the VOC patterns of 3 groups of volunteers and display results as numbers and graphs.
- Hold data on the local machine, then send it to the online database one person at a time or as a complete batch.
- Let researchers build AI models from healthy group and patient group data, and import models for prediction.
- Collect data and view reports on computers, mobile phones and tablets.
The main constraint was the hardware. The box was made by an outside manufacturer, and once the actual box arrived, the holes for the on/off button, the cable ports and the mounting holes for the board and fan still had to be modified to fit. A further point is that this system is a research tool, not a medical device for diagnosing disease.
How does this system collect and classify breath data?
The system receives breath through the gas sensor box, reads sensor values with a circuit board we developed, holds data on the local machine with the Data Collector program, then sends it to an online database. The web application then uses this data to build models, predict results and display them as numbers and graphs.
We chose to hold data on the local machine first so that collecting samples from volunteers could continue even without internet access. Model building sits on the web so that researchers can create new models from healthy group and patient group data, or import selected models, through the web pages for creating and importing models.
- 1
Volunteers blow into the gas sensor box
The box contains 10 sensors and an air chamber that uses tubes and air lines to disperse breath to the face of every sensor. The circuit board we developed reads values from the sensors and passes them to a computer.
- 2
Data Collector sorts and holds data on the local machine
The Data Collector program sorts the measured values and stores them on the local machine first, then sends them to the online database one person at a time or as a complete batch.
- 3
Create or import an SVM AI model
Researchers create an SVM AI model (Support Vector Machine, an algorithm for classifying data into groups) from healthy group and patient group data through the web page, or import a selected model, then use that model to predict results from new breath data.
- 4
View results as numbers, graphs and history
The web application has pages for recorded values, graphs, predictions shown as probability values, analysis and measurement history. The terms of reference required it to be viewable on a computer, mobile phone or tablet.
- 5
Calibrate the sensors against standard gases
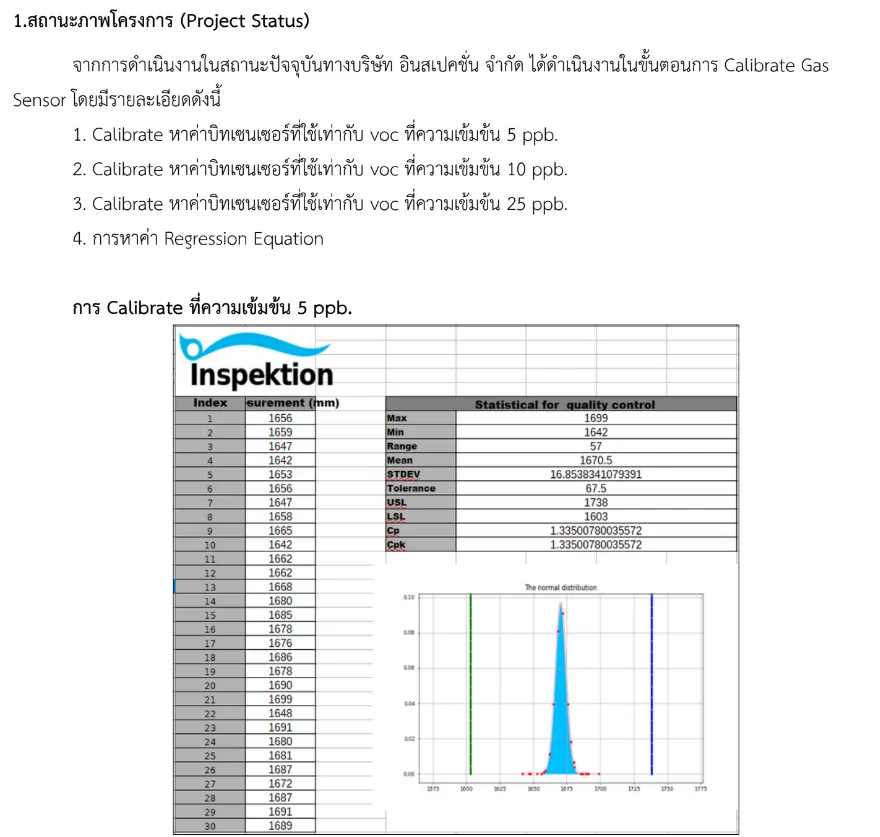
We collected calibration data at the Environmental Research and Training Centre of the Department of Environmental Quality Promotion by releasing standard VOC gas mixtures at concentrations of 5, 10 and 25 ppb (parts per billion) into the device, then used linear regression to find equations converting raw sensor values into concentrations.
Deliverables
We delivered the prototype hardware, software, documentation and calibration work, as listed below.
- A sensor reading circuit board of our own design.
- A prototype gas sensor box with 10 sensors and an air chamber that uses tubes and air lines to disperse breath to the face of every sensor.
- The Data Collector program for sorting and holding data on the local machine before sending it to the online database.
- A web application (PHP, Python, JavaScript) on Ubuntu Linux using SQLite / PostgreSQL databases, with pages for recorded values, graphs, predictions, analysis, history, model creation and model import.
- User manual
- A report on sensor calibration results against standard VOC gas mixtures at 5, 10 and 25 ppb, with conversion equations from linear regression.
What phases did this project go through?
This project ran from Jul 2019 to Apr 2020, divided into work under the original requirements and additional work after the demonstration. The sequence of work was as follows.
- Jul–Oct 2019: Started work to the requirements and completed the sensor reading circuit board.
- Nov 2019: Demonstrated the device and program and handed over the user manual. The client asked for an air chamber to be added and the screens to be adapted for smartphones.
- Jan–Feb 2020: Received the box from the outside manufacturer, checked the mounting points and cable ports that needed modification, and built the air chamber.
- Feb–Apr 2020: Collected calibration data, found the conversion equations using linear regression and prepared the results report.
Results confirmed at project close
The confirmed results of this case are the demonstration and the calibration work, both supported by documents. In November 2019 we demonstrated the device and program to representatives of the main contractor and the Department of Environmental Quality Promotion, and handed over the user manual. In 2020 we calibrated the sensors against standard VOC gas mixtures at 5, 10 and 25 ppb and obtained equations converting sensor values into concentrations using linear regression.
Our annual records state that when the project closed in 2020 the software was complete, while the circuit could not yet read all the sensors. This case has no model accuracy figures from real-world use, so we report only what is confirmed by documents.
What we learned
This work offers 3 principles for gas sensor work that uses AI to classify patterns.
- The sample path is part of the measurement system. Breath must reach the face of every sensor. In this work, the air chamber that uses tubes and air lines to disperse breath was added after the demonstration. Sensor box design must therefore include the airflow path, not just sensor mounting positions.
- Separate calibration from classification. Calibration tells you what concentration a raw sensor value corresponds to, while the AI model does the pattern classification. When you plan the two tasks separately, you will know whether an error comes from the sensors or from the model.
- Check every signal channel before collecting real data. When the project closed, the software was complete but the circuit could not yet read all the sensors. Work with multiple sensors should therefore include a step to confirm that every sensor is sending values before data collection from volunteers begins.
How can you apply this approach to your own research?
If you are developing a prototype gas-measuring device and need software for data collection and model building alongside it, you can use the structure of this case: a sensor enclosure, a program that holds data locally, an online database, and a website for building models and displaying results. What needs adapting is the sensor type, the reading circuit and the concentration range used for calibration.
Reusable parts and parts that need adapting
| System part | Reusable | Needs adapting when |
|---|---|---|
| Data storage | Data Collector that holds data locally, then uploads it to the online system one person at a time or as a whole set | If you use a different type or number of sensors from this case, the reading circuit and data format must be adapted |
| Enclosure and air chamber | The principle of distributing the sample so that it reaches the face of every sensor | If the sample to be measured is not breath, the sample inlet must be redesigned |
| Calibration | Deriving a conversion equation with Linear Regression from standard gases at several concentrations | If your work uses a different concentration range, standard gases must be selected within the range actually used |
| Models and result display | Pages for building models, importing models and displaying results as figures and graphs | If the groups you need to classify differ from those in this case, sample data must be prepared anew for each group |
| Applications | A tool for research work | Use on real patients must go through the relevant medical procedures and regulations separately |
- Define the scope clearly from the outset, covering the software, the circuitry and the enclosure, because work that combines hardware and software often picks up additional work along the way.
- Allow time to wait for the enclosure from the external manufacturer, and time to modify the board mounting holes and cable ports once the actual enclosure arrives.
- Have sample data from each volunteer group ready, because the AI model needs real data to be built and tested.
Read more
- Custom system development service
- Data integration and AI development services for organisations
- AI / IoT consulting and system design service
- Prototype case: NOAA satellite signal reception and decoding
- Prototype case: self-learning AI pick-and-place robot arm
- Article summarising the Low-Code AI & IoT activity for smart agriculture and environmental research
Technology used
Frequently Asked Questions
Can this system be used to diagnose disease?
No. The system was delivered as a research tool for the Department of Environmental Quality Promotion, for collecting data and classifying VOC patterns from volunteers' breath. It is not a medical device. The probability value the model displays is a model score, and is not yet an actual likelihood of disease until it has been tested against data with known outcomes.
What happens if there is no internet connection during data collection?
The Data Collector program first holds the data on the computer, then uploads it to the online database one person at a time or as a whole set when ready. Data collection can therefore continue without internet access, with the upload to the system taking place later.
Can researchers change the AI model themselves?
Yes. The web application has a page for building SVM AI models from data on the normal group and the patient group, and a model import page for selecting the model used for prediction.
Why must the sensors be calibrated with standard gas?
Because the values read from the sensor are raw electrical values, not units of concentration. We therefore released a standard VOC gas mixture at 5, 10 and 25 ppb into the device, then derived a conversion equation with Linear Regression.
How much time and budget does work of this kind take?
There is no standard price. Work of this kind is designed around the research brief, the sensor type and the number of sets required. This case ran from Jul 2019 to Apr 2020, including additional work after the demonstration. Please contact us for a quotation based on the actual scope of work.