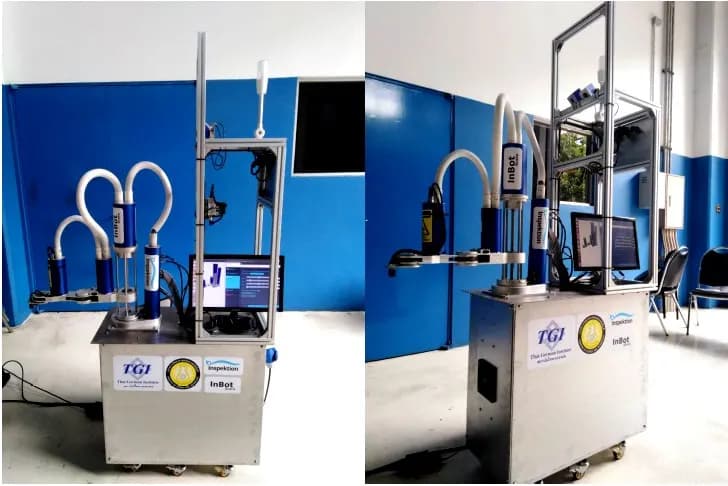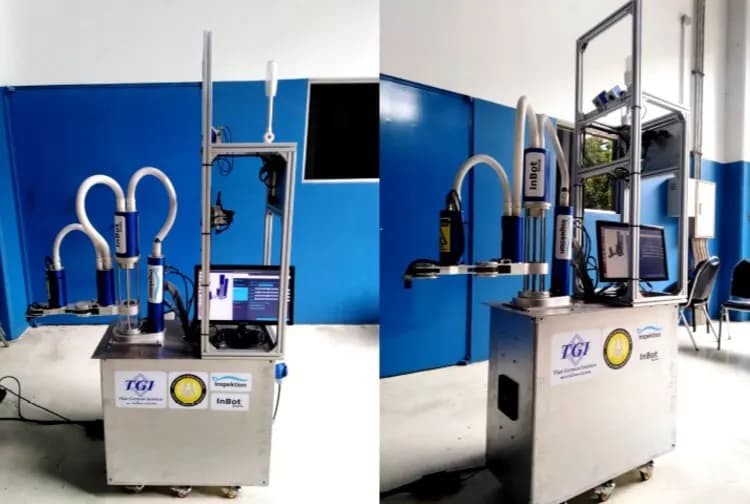





Instrument panel signal and vibration reader for heavy-duty vehicles, for an industrial institute in Thailand
Organisation: Thai-German Institute (TGI)
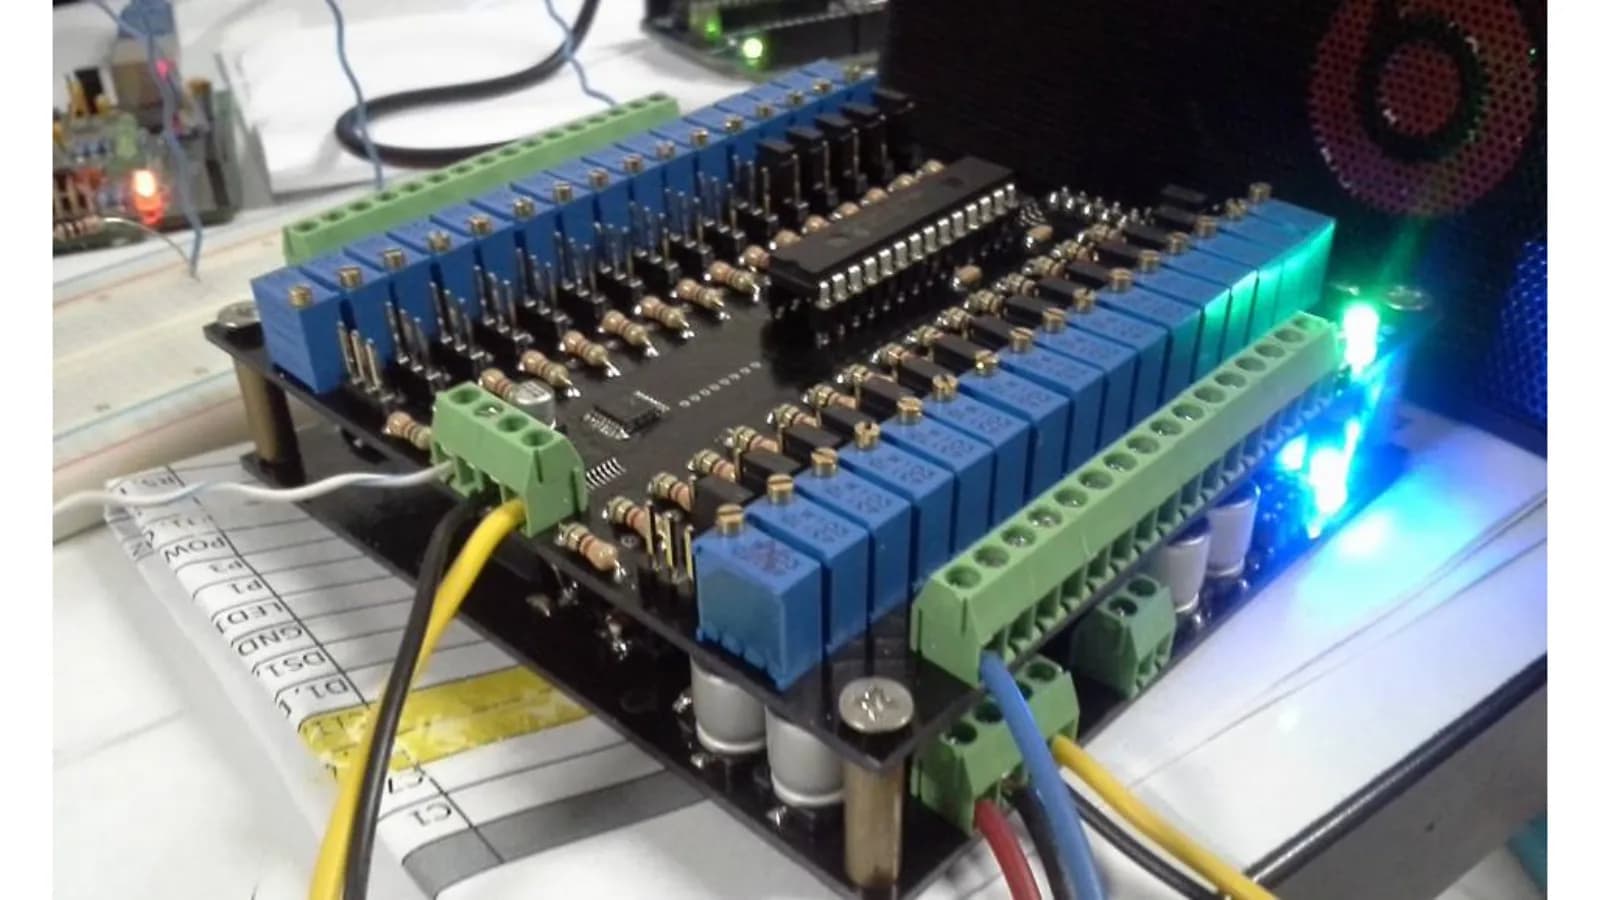
This signal reader is a Data Logger that reads values from the instrument panel and sensors of a heavy-duty vehicle, then displays 15 sensor values as line charts over time on a single screen. We designed a signal input circuit with 8 Analog channels and 4 Digital channels, plus a 3-axis Accelerometer (a sensor that measures acceleration and vibration), on an NVIDIA Jetson Nano board for an industrial institute in Thailand, and closed out the work according to the scope of work.
- Industry
- Government
- Year
- 2019
- Scope of work
- Signal input circuit with 8 Analog channels and 4 Digital channels (5 V Active Low) with enclosure and connectors, 4–20 mA to 0–10 V signal converter module, 3-axis Accelerometer and temperature sensor, configuration of the Kernel (the operating system core) and libraries on the NVIDIA Jetson Nano board, controller and signal interface section, web app displaying charts of 15 sensor values, and a user manual, for heavy-duty vehicles running on 24 V power
Summary
- This signal reader takes 8 Analog channels and 4 Digital channels from the instrument panel and sensors of a heavy-duty vehicle, together with a 3-axis Accelerometer (a sensor that measures acceleration and vibration) and a temperature sensor.
- The NVIDIA Jetson Nano board stores values in a SQLite database and displays line charts of 15 sensor values over time through an on-device web app. Users can choose to hide charts of sensors they do not want to view.
- We closed out the work according to the scope of work and delivered a user manual covering everything from connecting the display to opening the chart page.
- Principle from this work: start the design from a list of signals measured on the real equipment, and convert signals into a single format right from the input.
The on-site brief
The customer wanted to read values from the instrument panel of a heavy-duty vehicle, such as engine speed, oil pressure, engine temperature, hydraulic temperature, fuel level and voltage, and display them as charts over time. These signals come in 3 types: 0–10 V voltage, 4–20 mA current and on/off signals. The vehicle runs on 24 V power.
What we did
We designed a signal input circuit with 8 Analog channels (7 channels of 0–10 V and 1 channel of 4–20 mA) and 4 Digital channels, connected to an ESP32 (a microcontroller board) and a 3-axis Accelerometer, which then sends data to an NVIDIA Jetson Nano board. This board stores values in SQLite (a small on-device database) and displays line charts of 15 sensor values through an on-device web app.
- Vehicle instrument panel and sensors8 Analog channels · 4 Digital channels
- 3-axis Accelerometer (a sensor that measures acceleration and vibration)+ temperature sensor
- Signal input circuit + ESP32
- NVIDIA Jetson NanoStores values in SQLite
- Line chart web app15 sensor values over time
Results
We closed out the work according to the scope of work, with a user manual. During handover, signal reading was tested with a set of instrument gauges provided on site, because the vehicle's actual sensors were not yet available for testing.
How the brief came about
The brief for this case was to turn values from a heavy-duty vehicle's instrument panel into digital data that can be viewed as charts over time. The required values include engine speed, oil pressure, engine temperature, hydraulic temperature, fuel level and voltage. The customer wanted to see all values on a single screen, along with the vehicle's vibration values.
A needle-type instrument panel shows only the value at that moment. If the temperature rises briefly or oil pressure drops momentarily, the driver may not see it. Once every value is stored as a chart over time, engineers can see relationships between values, such as temperature and engine speed, and use them as a starting point for analysing problems.
Requirements and constraints
The signal reader has to accept several signal types from the same vehicle and work with the vehicle's power system. The main requirements and constraints according to the project documents are as follows.
- Accept 7 Analog voltage channels of 0–10 V and 1 Analog current channel of 4–20 mA
- Accept 4 Digital channels of 5 V Active Low (active when the signal is at zero) for on/off signals
- Measure vibration on 3 axes and read one additional temperature value
- Run on the vehicle's 24 V power, with the design documents setting out an approach for installation on tractors used in factories or sugarcane fields
- Display charts of 15 sensor values on a single screen, with users able to choose to hide or show the chart of each sensor
What are 0–10 V and 4–20 mA signals?
Both are Analog signals widely used in industrial work. A sensor sends a voltage (0–10 V) or a current (4–20 mA) that changes with the measured value. The signal input circuit must support the matching type so that the signal can be converted back to the correct actual value.
How does this signal reader read values from the vehicle's instrument panel?
This signal reader connects to the existing signal wires of the vehicle's instrument panel and sensors, then reads every channel at the same time. The signal input circuit separates channels by signal type, the ESP32 reads values from the circuit, and the NVIDIA Jetson Nano board stores the values and displays the charts. Users therefore do not need to note down values from the panel's needles themselves.
The current signal passes through a converter module to become a voltage before entering the circuit, so every Analog channel receives signals in the same format. The roles are clearly separated: the ESP32 reads signals, while the NVIDIA Jetson Nano stores data and displays results.
- 1
Measuring instrument panel signals on site
We measured the electrical signals of the instrument panel on site, namely engine speed (Tacho Meter), oil pressure, hydraulic temperature, engine temperature, fuel level and voltage, in order to design the circuit to accept signals in the correct range.
- 2
Bringing signals into the circuit
The circuit receives Analog and Digital signals as listed in the requirements above. Each channel connects to the existing signal wire of the instrument panel or sensor.
- 3
Measuring vibration and temperature
The 3-axis Accelerometer measures vibration along the x, y and z axes, while the temperature sensor reads one additional value.
- 4
ESP32 and NVIDIA Jetson Nano store the data
The ESP32 reads values from the circuit and passes them to the NVIDIA Jetson Nano board running Ubuntu. A program written in Python receives the values and stores them in a SQLite database.
- 5
Viewing charts through the web app
Users connect a display via an HDMI cable, open a web browser on the device, and view line charts of 15 sensor values. The horizontal axis is time, the vertical axis is the value read, and users can click to hide sensors they do not want to view.
Deliverables
We delivered the signal reader with software on the NVIDIA Jetson Nano board and a user manual. The items according to the scope of work are as follows.
- Signal input circuit as listed in the requirements, with enclosure and connectors
- Current-to-voltage signal converter module, 3-axis Accelerometer and temperature sensor
- Configuration of the Kernel (the operating system core) and libraries on the NVIDIA Jetson Nano board
- Controller and signal interface section
- Web app with line charts of 15 sensor values, storing data in an on-device SQLite database
- The full software set is written in Arduino, Python and PHP
- User manual, from connecting the display to opening the chart page
Confirmed results at project close
The confirmed result is that we closed out the work according to the scope of work and delivered a user manual. The delivered set reads 8 Analog channels and 4 Digital channels, then displays 15 sensor values as line charts over time on the NVIDIA Jetson Nano board.
During handover, we tested signal reading with a set of instrument gauges provided on site, because the vehicle's actual sensors were not yet available for testing. This result therefore confirms the operation of the circuit and the chart page, but it is not yet a result from use on an actual vehicle.
What we learned
This work offers 3 principles for reading signals from existing vehicles or machines.
- Start from a list of signals measured on the real equipment. This list must include the signal type, value range and number of channels for each value, because the signal input circuit, signal converter module and chart page are all designed from it.
- Convert signals into a single format right from the input. When the current signal is converted to a voltage before entering the circuit, every Analog channel can use the same type of input circuit and be read in the same way.
- Separate circuit testing from testing values in real use. Testing with a signal source on a bench confirms that the circuit can read signals, while values from real use must be confirmed with the sensors of the real equipment. An acceptance test plan should therefore be set, and sensors for testing prepared, from the start.
How can you apply this approach to your vehicle or machine?
If your vehicle or machine has an instrument panel and sensors that send voltage, current or on/off signals, you can use the same approach as this case: read signals from the existing wires, store the values on a unit in the vehicle, and display them as charts over time. What needs adapting depends on the signal types, the power system and the acceptance test method.
Reusable parts and parts that need adapting
| System part | Reusable | Needs adapting when |
|---|---|---|
| Signal input | Input circuit for Analog 0–10 V and 4–20 mA, and Digital on/off | If your signals have other types or ranges, or you need more channels than this, the input channels must be redesigned |
| Vibration and temperature measurement | 3-axis Accelerometer and temperature sensor | If you need to measure several points on the vehicle, the positions and number of sensors must be selected anew |
| Storage and display | NVIDIA Jetson Nano stores values in SQLite and displays line charts on a web app | If you need to send data to another system for further analysis, the data export format must be agreed from the start |
| Power system | Design for vehicles running on 24 V power | If the vehicle or machine uses a different power system, the power supply circuit must be adapted |
| Acceptance testing | Test procedure for the circuit and chart page | If you need to confirm values from real use, testing with the sensors of the real equipment must be added |
- Make a complete list of the signals you need to read, with the signal type and range of each value
- Check the power system of the vehicle or machine and the site conditions, such as dust, heat and vibration, which affect the choice of enclosure and how the equipment is mounted
- Prepare a real vehicle or real sensors for acceptance testing, and define which values must match which
Read more
- Custom system development service
- Consulting and system design service
- Case: pulling values from a casting machine PLC and storing them as daily files
- Case: bringing motor vibration values from the whole factory onto one screen
- Case: Car Dashboard board delivered with user training
- Article: how an I/O signal isolation board is designed for safety
Technology used
Frequently Asked Questions
What signals can this system read?
The system accepts 8 Analog channels (7 channels of 0–10 V voltage and 1 channel of 4–20 mA current), 4 Digital channels of 5 V Active Low, a 3-axis Accelerometer for vibration, and a temperature sensor.
How can the data be viewed?
Connect a display via an HDMI cable, then open the on-device web app through a web browser. The screen shows line charts of 15 sensor values over time, and you can choose to hide sensors you do not want to view.
Was it tested on a real vehicle at handover?
During handover, it had not yet been tested with the sensors of an actual vehicle. We tested signal reading with a set of instrument gauges provided on site. If it is used on an actual vehicle, testing with that vehicle's sensors should be planned again.
Can it be used with other vehicle makes or models?
It can be used when the vehicle's signals are 0–10 V voltage, 4–20 mA current or on/off, as supported by the circuit. The project documents are not tied to a vehicle brand, but the signal types and ranges of the actual vehicle must be surveyed first before we can confirm whether the circuit needs adjusting.
How much does it cost?
There is no standard price, because this work is designed to the customer's scope. Please contact us to request a quotation. We assess it based on the number and types of signals, the site conditions and the display format required.