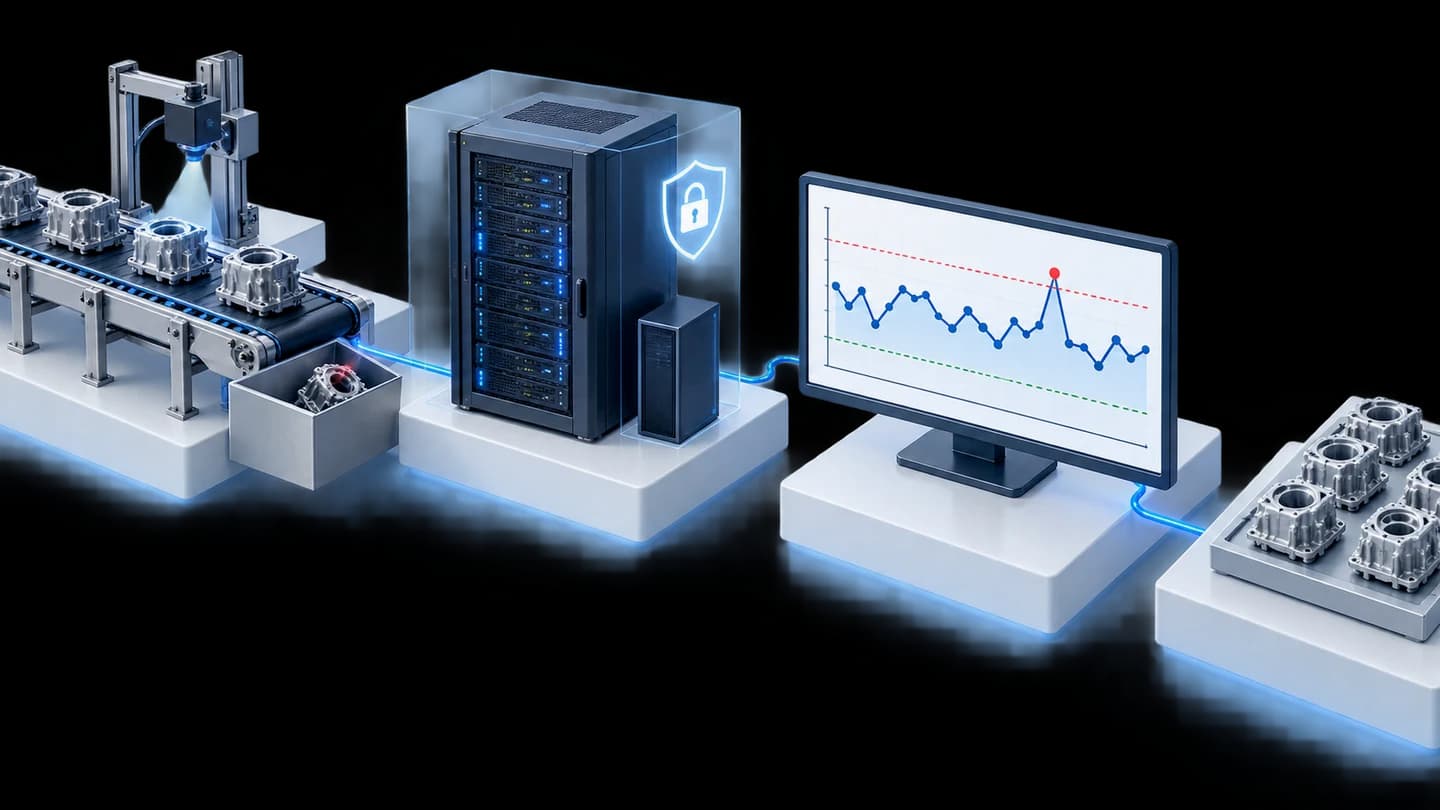





Radiator assembly line signal grouping system and production vs target display for an automotive parts manufacturer in Thailand
Customer: Automotive parts manufacturer (Japanese conglomerate)
The system in this case was designed to group signals from a radiator (car radiator) assembly line into one system and show actual production against target on a 65-inch 4K Smart TV. The customer is an automotive parts manufacturer in Thailand. We set up the network, configured the program, developed the display screen according to the concept in the customer's purchase request, and delivered in 2020.
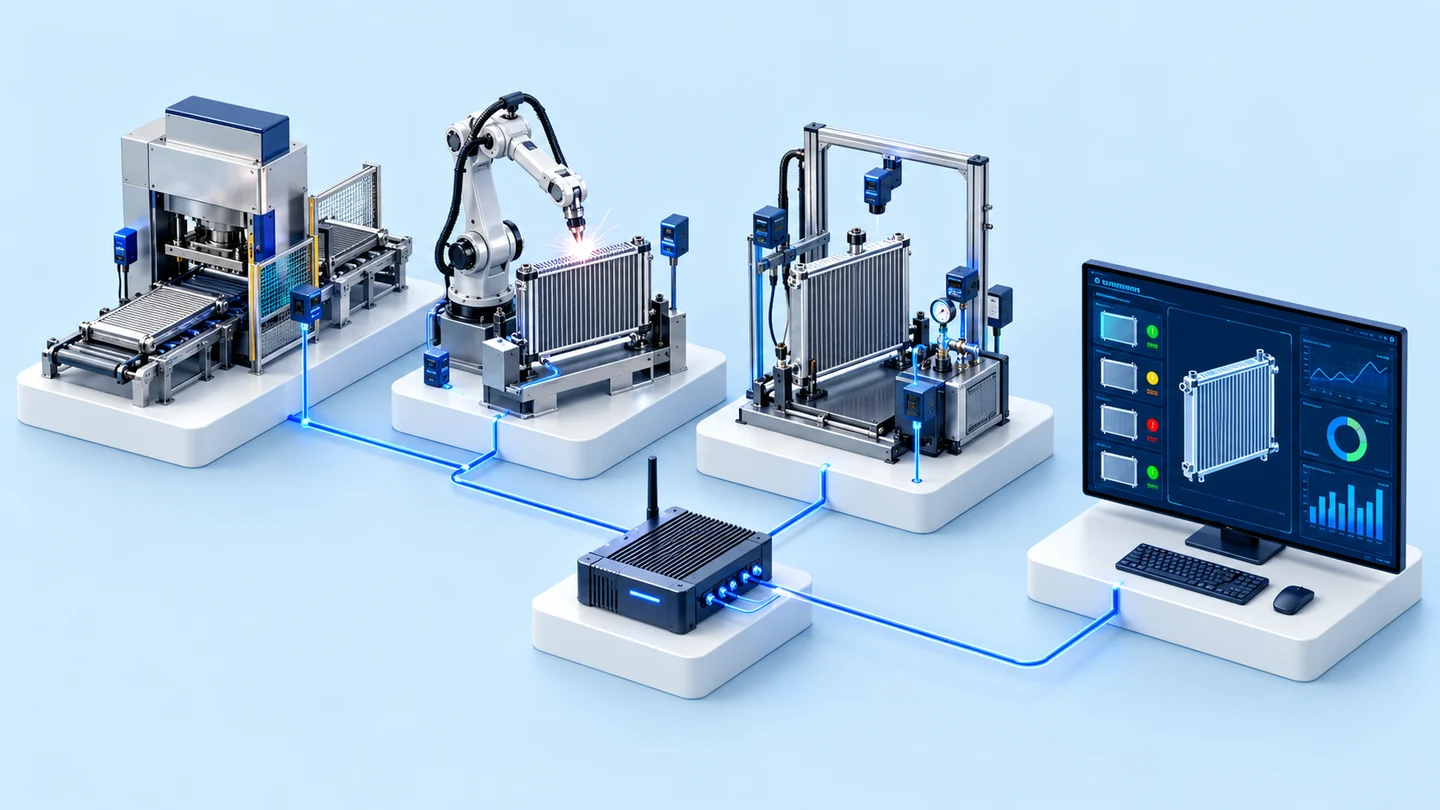
- Industry
- Automotive
- Year
- 2020
- Scope of work
- System analysis, network development, program configuration, data display screen development, supply of a 65-inch 4K Smart TV with stand and network equipment, network and system testing on site, project management and project documentation
Summary
- We set up a system to group signals from the radiator (car radiator) assembly line of an automotive parts manufacturer in Thailand and developed a screen showing actual production against target on a 65-inch 4K Smart TV, delivered in 2020.
- The display screen was designed according to the concept in the customer's purchase request: Target, Actual, a table by time period and a chart of actual production against target.
- A single job covered system analysis, network setup with a Gigabit router and signal extender, program configuration, and supply of the display with stand. The scope of work included network and system testing on site.
- The confirmed results come from the delivery documents: equipment delivered against the delivery note in October 2020, system work billed in the same month, and the project closed in the same year. This case has no post-deployment measurement figures.
The on-site brief
The customer wanted to see the radiator assembly line's actual production against target by time period. The concept in the purchase request was to group signals from the production line into one system and show them on a large display in real time, so that the line side and the office could view the same set of data.
What we did
We set up the network with a Gigabit router and signal extender (Repeater), configured a program to group signals from the production line, and developed a data display screen (Data Visualization) according to the concept in the purchase request, on a 65-inch 4K Smart TV. The scope of work included network testing on site and system testing both at our company and on site.
Results
We delivered the display and network equipment against the delivery note in October 2020 and billed the system and display screen work in the same month. The company's annual project summary records that this project finished in 2020 and was handed over as normal. This case has no post-deployment measurement figures.
How the brief came about
The brief for this case was to let the line side and the office see the radiator assembly line's actual production against target from the same set of data. The customer outlined this concept in the purchase request: group signals from the production line into one system, then show them on a large display in real time.
The customer is an automotive parts manufacturer in Thailand. A radiator here means a car radiator. The question the screen has to answer is whether the line's actual production is keeping up with the target in each time period.
What is Target vs Actual?
Target is the number of pieces the line should produce within a given time period, and Actual is the number really produced. When the two are shown side by side for each time period, viewers can see in which periods production is behind target.
What must be defined before work starts on a production display like this?
The data to be shown and the connection method must be defined before work starts. In this case, the customer's purchase request defined both. The combined screen for the office shows data in real time, and the line screen shows the target, actual production, a table by time period and a chart of actual production against target. For connection, it specified both Ethernet (wired network) and Wi-Fi. The main requirements are as follows.
- Group signals from the production line into one system
- Show results on a large display in real time, so that the line side and the office view the same set of data
- The line screen shows Target, Actual, a table by time period and a chart of actual production against target
- Connect via Ethernet and Wi-Fi, according to the concept in the purchase request
Why did this job include network setup along with the screen?
The screen can show production in real time only if data can travel continuously from the line to the display. This job therefore combined system analysis, network setup, signal grouping program configuration, the display screen and the display itself in a single job. The network used a Gigabit router and signal extender (Repeater), and the scope of work included network testing on site.
The data display screen (Data Visualization) is a system we developed specifically for this job according to the concept in the purchase request. The quotation for this job directly references the customer's purchase request.
Deliverables
We delivered the system work and the equipment in a single project. The items on the quotation and delivery note are as follows.
- System work: system analysis, network development, signal grouping program configuration and data display screen development
- Display equipment: 65-inch 4K Smart TV with stand, wireless keyboard and mouse
- Network equipment: Gigabit router and signal extender (Repeater)
- Testing within the scope of work: network testing on site, and system testing both at our company and on site
- Project management and project documentation
Results confirmed from the delivery documents
The confirmed results of this case are delivery and project closure. We delivered the display and network equipment against the delivery note in October 2020 and billed the system and display screen work in the same month. The company's annual project summary records that this project finished in 2020 and was handed over as normal.
This case has no post-deployment measurement figures. The display screen in this case is described according to the concept in the purchase request, and we do not report business results.
What we learned
This job offers the following principles for line-side production display work.
- The display is the end point of the system, not the system itself. The figures on it can be trusted once the data path from the line to the display has passed testing on site.
- Use the user's screen draft as the specification from the quotation stage onwards. In this job, the customer set out the figures, tables and charts it needed in the purchase request, and the quotation referenced that request.
- The office and line-side displays should read from the same set of data, so the figures at the two points do not conflict. The purchase request for this job specified both a combined screen for the office and a screen for the line, using signals grouped into one system.
How this approach can apply to your factory
If your factory sets production targets by time period and wants the line side and the office to see the same set of figures, you can use the same approach as this case: group signals from the line, set up the network to the display, then show actual production against target. What needs adapting is the source of the production count signal and the network conditions in your factory.
Reusable parts and parts that need adapting
| System part | Reusable | Needs adapting when |
|---|---|---|
| Production count signal source | Grouping signals from the line into one system | Your production count may come from machines, piece-counting sensors or button-press recording at the line. First check how the signal can be received. |
| Network | Gigabit router with signal extender, and network testing on site | If the distance from the line to the display mounting point is long or there are obstructions, cabling may be needed instead of a signal extender. |
| Display screen | Target, actual production, a table by time period and a chart of actual production against target | If you need other figures, such as the variance from target, the list of figures must be agreed before development. |
| Display and mounting position | Large Smart TV with stand | If the viewing distance from the line differs from this case, the display size and position must be chosen afresh. |
| Data history | The grouped signals can serve as a data source. | If you need historical analysis, data storage should be planned from the start. |
- Check where each line's production count signal comes from and in what format it can be exported.
- Survey the network signal from the line to the display mounting point before choosing between a signal extender and cabling.
- Decide who is responsible for setting the target in each shift, and which figures must appear on the display.
- Start with a line that has a clear target and a production count signal ready to use, test the screen with the on-site team, then expand to other lines.
Read more
- DoLINE: production line tracking system and line-side production target board
- Step-by-step configuration instructions for the DoLINE Target Board
- nimitFlow: Low-Code platform for automation and Data Pipeline work
- Custom inspection and control system development service
- AI and IoT system installation service for factories
- Case: multi-line production output and operating rate tracking system for an automotive parts manufacturer
- Case: push-button production count system with a plan vs actual display
Technology used
Frequently Asked Questions
What data does the screen in this case show?
The display screen was designed according to the concept in the customer's purchase request. It shows Target, Actual, a table by time period and a chart of actual production against target for the radiator assembly line, on a 65-inch 4K Smart TV.
What equipment was used?
A 65-inch 4K Smart TV with stand, wireless keyboard and mouse, plus a Gigabit router and signal extender (Repeater) for sending data from the line to the display.
Can a wireless network be used, or is cabling required?
In this case, the customer's concept specified both Ethernet and Wi-Fi connections, and we used a Gigabit router with a signal extender. For your factory, the distance and obstructions from the line to the display mounting point must be surveyed first, and the connection method chosen after that.
Has this project been delivered, and are there measurable results?
Yes, it has been delivered. We delivered the display and network equipment against the delivery note in October 2020, billed the system work in the same month and closed the project in the same year. This case has no post-deployment measurement figures.
If I want a production vs target display now, how should I start?
If you need a line-side production target board, you can start with DoLINE; see the product page for details. If you need to group signals from machines on several lines, set up a network or design a custom screen, you can request a quotation. We will survey the site before proposing an approach.