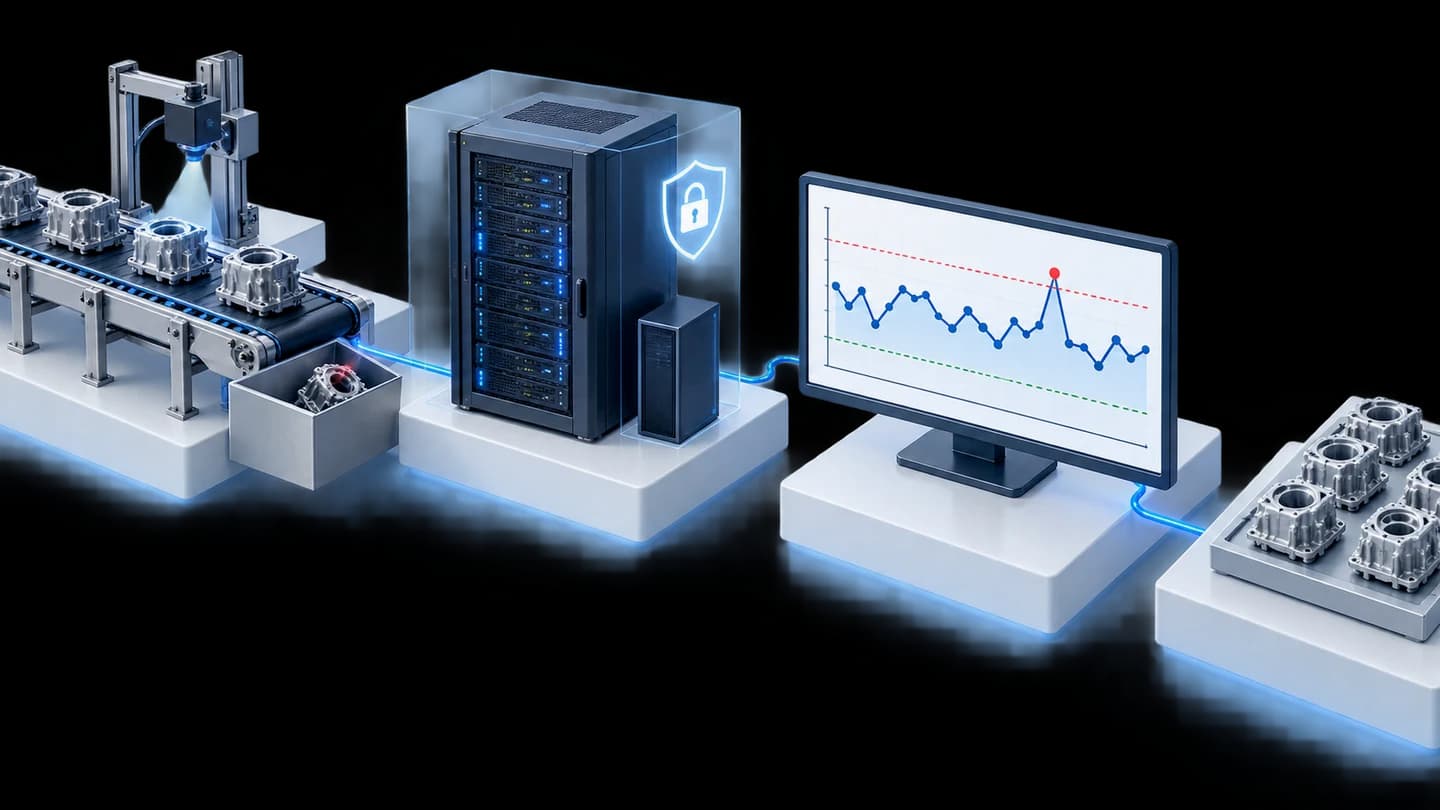





Production tracking and operation ratio monitoring system for 9 lines for automotive parts manufacturers in Thailand
Customer: Automotive parts manufacturer (Japanese conglomerate)
Overall Monitoring is a web app that tracks production by aggregating production counts from 9 production lines onto an internal factory server. It displays actual vs. hourly targets, operation ratios, and reasons for lost time, viewable by shift, day, month, and year. We developed this system for automotive parts manufacturers in Thailand in B.E. 2563-2564 and in 2565, customers hired us to expand the same system to additional production lines, adding another 11 production lines.
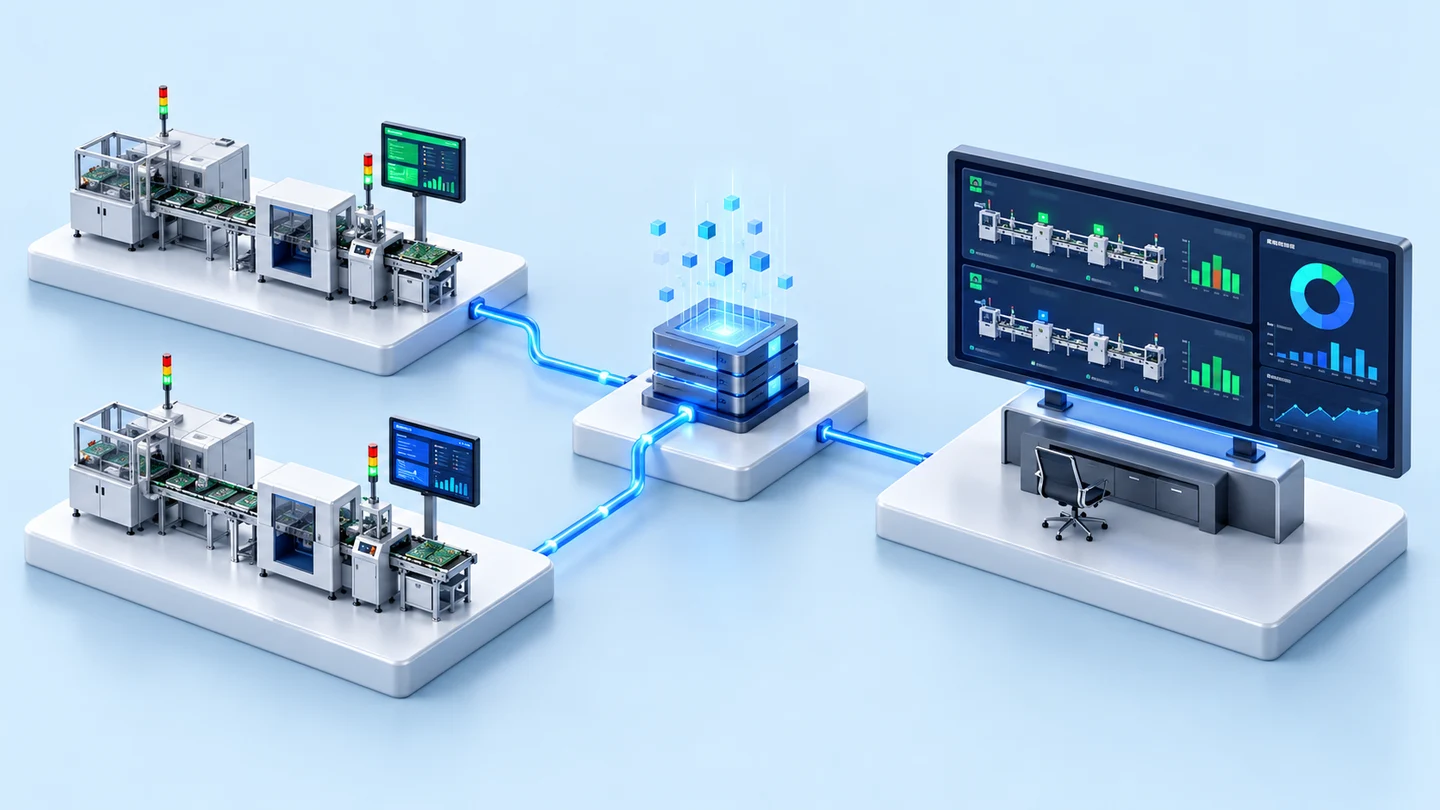
- PLC for each production line9 lines
- Data ShareDedicated machine on each line
- Siemens SIMATIC IPC627EIn-factory IIS web server
- Overall Monitoring web appProduction status + OR Board
- Operation Ratio and Loss analysisBy shift, day, month and year
- Industry
- Automotive
- Year
- 2020–2021
- Scope of work
- 2020 work: Data Views (line data display screens) on a large display, and online Data Views for 2 lines on a server we arranged to rent for the customer · 2020–2021 work: the Overall Monitoring web app on a Siemens SIMATIC IPC627E industrial computer (Windows 10) inside the factory, connecting data from Data Share on 9 production lines, with an overview page, production status, problem logging, Operation Ratio and Loss analysis, shift settings and an OR Board for each line · Data Share configuration with the PLCs, server hardware and the LAN network were handled by the customer's own team
Summary
- Overall Monitoring is a web app that receives production counts from the Data Share system of 9 production lines and brings them together on a server inside the factory, which is not connected to the internet.
- The production status page shows hourly actual production against target, separated into day and night shifts. The result cell turns green when the target is reached and red when below target.
- The production department logs problems with their time periods and Loss categories, then views the Operation Ratio and causes of loss time by day, month and year through pie charts and Pareto Charts (charts ranking causes from most to least).
- Close-out test results: the machines on all 9 production lines could open the web app from the central server, and the Loss and Operation Ratio pages could calculate on the pilot line.
- We delivered the system in 2021, and in 2022 the customer engaged us to extend the same system to additional production lines, a further 11 production lines in total.
The on-site brief
Each line's production count sat with that line's machines and PLC (the device that controls the machines). The production department wanted to see actual production against target and the Operation Ratio of every line from one place, separated into day and night shifts, and to record the causes of lost line time. The system had to run on the factory's internal network, which is not connected to the internet (Offline).
What we did
We developed the Overall Monitoring web app, installed on a Siemens SIMATIC IPC627E industrial computer inside the factory. The program receives production counts from the Data Share system (the production data receiving system configured by the customer's team) on all 9 lines, then shows hourly production against target, a problem log page organised by loss time category (Loss), and Operation Ratio and Loss analysis charts that can be exported to PDF and Excel.
Results
The close-out test confirmed that the machines on all 9 production lines could open the web app from the central server, and that the Loss and Operation Ratio pages could calculate on the pilot line. We later adjusted the real-time calculation under a change request document, then delivered to requirements and supported normal use in 2021. In 2022, the customer engaged us to extend the system to additional production lines, a further 11 production lines in total.
Measured results
- Production lines with data connected to the system
- 9
How the brief came about
The challenge in this case was to see actual production against target and the Operation Ratio of every line from a single web page. Each line's production count sat with that line's machines and PLC. The production department wanted to see results separately for day and night shifts, and to log the problems that cost the lines time, in order to see which causes of loss time occurred most often.
Our work with this customer began in 2020 with Data Views (line data display screens) on a large display, and online Data Views for 2 lines on a server we arranged to rent for them. The next step was a system bringing all lines together on a server inside the factory, which is the main work in this case.
What is Operation Ratio (OR)?
Operation Ratio, or operating rate, is the actual production count compared with the count that should be achieved if the line ran for its full time at the standard cycle. In this system it is calculated cumulatively, hour by hour through the shift. If the value is below target, users can go on to see, from the logged entries, which problems the time was lost to.
Requirements and constraints
The system had to receive data from systems the factory already had, and run on the internal network only. The main requirements and constraints are as follows.
- Receive production counts from Data Share on the dedicated machines of all 9 lines into a server inside the factory, Offline (not connected to the internet)
- The customer's team configured Data Share with the PLCs, supplied the server hardware and laid out the LAN network themselves, while we developed the data receiving program and the web pages
- Show hourly actual production against target, separated into day and night shifts
- Users can set working hours, break periods, Takt Time (the time that should be taken to produce one piece according to demand) and OR targets themselves by date range. Break periods are not counted as loss time
- Log problems with their time periods and Loss A, Loss B or Loss C category
- View history by day, month and year, and export to PDF or Excel
How does this system combine production counts from several lines?
This system combines production counts by receiving values from the Data Share that each line's dedicated machine already has, so we did not need to connect to the PLCs ourselves. The customer's team configured Data Share to receive production count signals from the PLCs, while our program pulls the values from the line machines into the central server, then calculates production against target and Operation Ratio.
Dividing the work this way made each party's scope clear. The machinery and network side stayed with the customer's team, and the program and calculation formula side stayed with us. The requirements document specified that the system sit on an internal Offline server, so production data stays within the factory network, unlike the early online Data Views work, which used a rented server.
- 1
Receive production counts from Data Share
A program on the central server pulls production counts from the dedicated machines of all 9 lines over the factory's internal network.
- 2
Calculate by shift and target
The system uses the working hours, break periods, Takt Time and OR target set by the user to calculate the expected count and cumulative Operation Ratio, hour by hour through the shift.
- 3
Show production against target
The production status page shows hourly actual production against target. The result cell (Judge) turns green when actual production reaches target and red when it is below target.
- 4
Log and analyse loss time
Users log the problem, time period and Loss category. The system calculates the duration and the share of loss time against the shift's working time, then displays them as pie charts and a Pareto Chart.
Deliverables
We delivered the Overall Monitoring web app, installed on a Siemens SIMATIC IPC627E industrial computer (Windows 10) acting as an IIS web server (the Windows web server system) inside the factory. The machines on all 9 production lines view it through a web browser on the internal network.
- Overview page: production status of all lines on one page
- Per-line production status page: Takt Time, actual cycle time, cumulative count against target, and an hourly count table with green and red result cells
- Problem log page: problem, time period and Loss A, Loss B, Loss C category, with the duration and share of loss time calculated by the system
- Operation Ratio and Loss analysis page: bar charts, pie charts and Pareto Charts, viewable by day, month and year, and by day shift, night shift or both shifts combined
- Shift settings page: working periods, break periods, Takt Time and OR target by date range
- An OR Board (Operation Ratio summary screen) for each line, opened from that line's Operation Ratio page
- Export of reports to PDF and Excel
How was this system extended from the pilot line to other lines?
We extended the system step by step, testing the Loss and Operation Ratio calculations on the pilot line. This made it possible to check the formulas against real data before using them on other lines. The sequence of work was as follows.
- 2020: Data Views showing line data on a large display, and online Data Views for 2 lines on a server we arranged to rent for the customer
- 2020–2021: developed Overall Monitoring on a server inside the factory, tested the Loss and Operation Ratio calculations on the pilot line, and tested opening the web app from the machines of all 9 lines
- 2021: the customer tested the system in real use; we adjusted the real-time calculation and the screens under change request documents, then delivered and supported normal use
- 2022: the customer engaged us to extend the same system to additional production lines, a further 11 production lines in total
Confirmed results from the close-out test
In the close-out test, the machines on all 9 production lines could open the Overall Monitoring web app from the central server, including after an IIS restart. The Loss and Operation Ratio pages could calculate on the pilot line, and the OR Board could display results. This case has no business performance figures, so we report only results confirmed by documents.
After the customer tested the system in real use, we adjusted the real-time calculation and the screens under change request documents, and every item passed our team's check. We delivered to requirements and supported normal use in 2021. Then in 2022, this automotive parts manufacturer engaged us to extend the same system to additional production lines, a further 11 production lines in total.
What we learned
The main lessons from this work are to agree formulas and acceptance criteria before development, to test with mid-shift data, and to assign someone to look after the source data of every line.
- Agree the calculation formulas and acceptance criteria clearly before development starts. In this work, requirements changed along the way, and the scope of testing and acceptance had not been agreed at the outset, so the work had to be adjusted under change request documents after the customer's testing.
- Test sets must include mid-shift data, not only end-of-shift data. The original test set for this work covered only full-day end-of-shift cases, so the real-time mid-shift calculation had to be adjusted after the customer began real use.
- A system that combines data from several lines must clearly name who looks after the source side, and check that data from every line is arriving in full. In this work, production counts from some lines entered the system intermittently. A clear division of duties helped show whether to check the Data Share side or the program side.
How this approach can apply to your factory
If your factory has several production lines and works in shifts, you can use the same approach as this case: receive production counts from the system the line already has, calculate against target by shift and Takt Time, then log the causes of loss time by category. What needs adjusting is how production counts are received, when your lines have no data-sending system like Data Share.
Reusable parts and parts that need adapting
| System part | Reusable | Needs adapting when |
|---|---|---|
| Receiving production counts | Receiving values from the line machines into the central server | Your lines do not yet have a system for sending production counts. First check how counts can be pulled from the PLC or machine. |
| Calculation | Hourly production against target and cumulative Operation Ratio by shift | Your definitions of working time, breaks or the OR formula differ from this case. The formula and calculation examples must be agreed afresh. |
| Loss time categories | Logging problems with their time periods and Loss category | Your factory divides Loss categories differently. The list of categories must be redefined. |
| Installation | Offline web server inside the factory | It must be viewable from networks other than the production line's. The network and access rights must be planned together with the IT department. |
- Have shift data, break periods, Takt Time and targets for each line ready, because they are the basis of the calculations on every page
- Prepare test data sets for both end-of-shift and mid-shift cases
- Choose one pilot line to check the formulas against real data before expanding.
- Agree clearly who is responsible for the machines, the network and the program.
Read more
- Case: Cycle timing pilot on 1 production line, with video
- Case: moving the production data website for 11 lines to a central server
- Case: mould shot counting system with maintenance cycle alerts
- Custom system development service for factories
- DoLINE — ready-made line-side production target board
- nimitFlow — factory data integration platform
- Article: is On-Premise or Cloud better for storing factory data?
Technology used
Frequently Asked Questions
Where does this system get its production counts from?
From a Data Share system that receives production count signals from the PLC of each machine. The customer's team configured Data Share with the PLCs themselves, and we built the program that takes values from the dedicated machines on all 9 lines into the central server.
Does it require the cloud?
Not in this case. The system is installed on a Siemens SIMATIC IPC627E industrial computer inside the factory, which the project documents specify as an Offline internal server. Computers on the production lines open it through a web browser on the internal network.
How much detail can be viewed in historical data?
You can view it by the hour within a shift, by day, by month and by year, select the day shift, the night shift or both shifts combined, and export to PDF or Excel.
If our line has no Data Share, can this approach still be used?
Yes, but the way production counts are received has to change. The system delivered in this case receives counts from Data Share. If your line uses another method, we first need to check how production counts can be retrieved from the PLC or machines, and then assess the additional connection work.
If I want a system like this, how much does it cost?
There is no fixed price, because this is development work tailored to the requirements of each factory. We assess the number of lines, the existing data sources and the screens required, and then prepare a quotation.