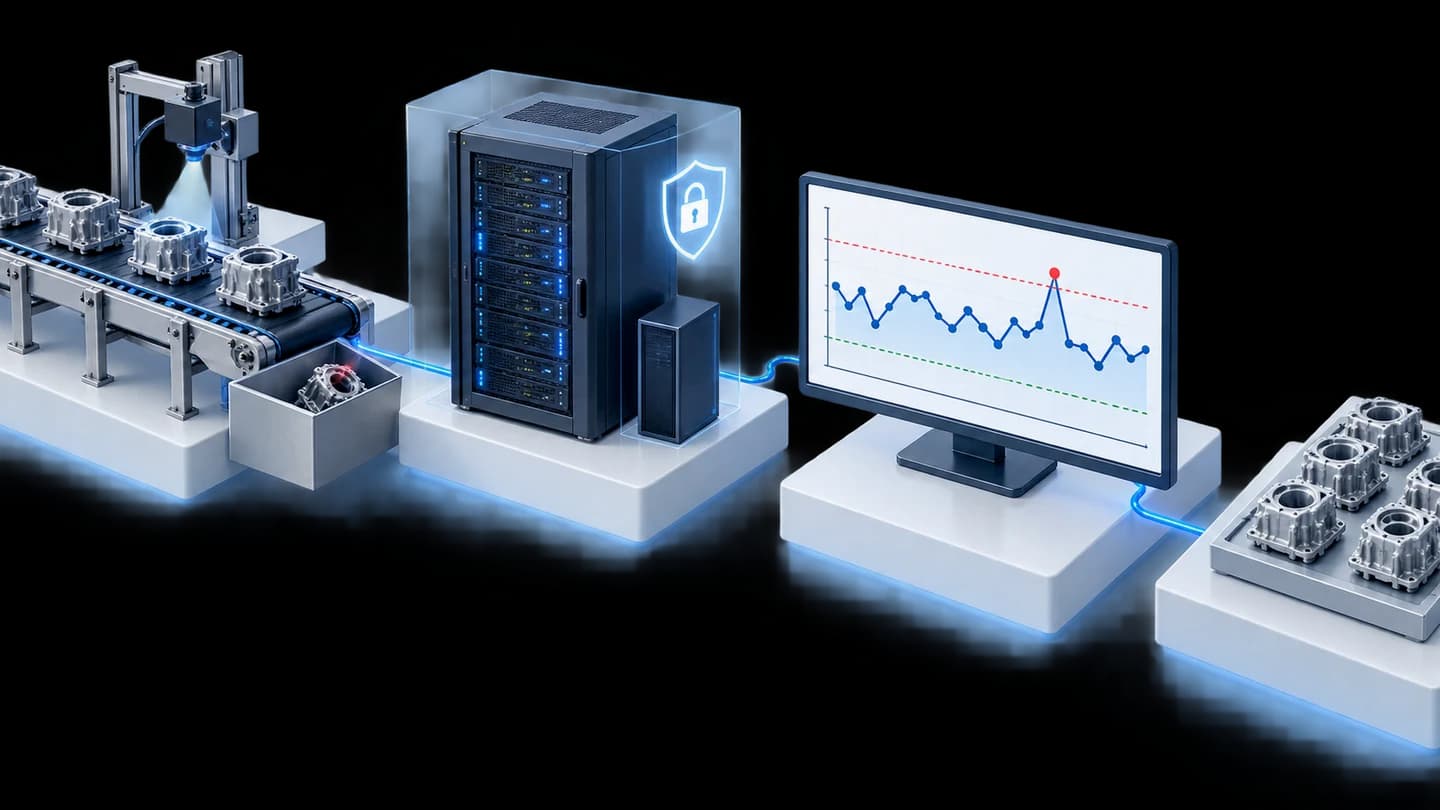





Cycle Time measurement system with video, piloted on 1 production line for an automotive parts manufacturer in Thailand
Customer: Automotive parts manufacturer (Japanese conglomerate)
The Cycle Time system with video measures the Cycle Time (the time a workstation takes per 1 work cycle) of each workstation on a production line, shows it on a chart against the standard time, and lets users click a point on the chart to open on-site video of that moment. We built it as a 2-phase pilot on 1 production line of an automotive parts manufacturer in Thailand in 2019, and delivered follow-on work for the customer's factory in Cambodia in 2020.
- Industry
- Automotive
- Year
- 2019
- Scope of work
- A cycle timing system with video for 1 production line, displaying 4 workstations, reading signals from the PLC and designed for 7 cameras as per the project specification (5 assigned to workstations and 2 wide-angle covering the whole line), with a web app viewable on a tablet.
- Duration
- 2 phases, April to October 2019
Summary
- The cycle timing system with video was a pilot on 1 production line at an automotive parts manufacturer in Thailand, timing the Cycle Time of 4 workstations and displaying it as a chart against the TT/TCT standard times.
- Click a point on the chart to open on-site video of that period stored on the NAS, so the team can see the cause of a slow cycle from the footage without guessing.
- The first phase received cycle start and end signals from a photo sensor; the second phase switched to reading signals from the PLC and was designed with 7 cameras as per the project specification.
- The first phase passed acceptance against the checklist (Exit Criteria) with the customer's representatives in May 2019. The second phase closed the project in October 2019.
- Follow-on work was a phase for the customer's factory in Cambodia, with the site survey in 2019 and delivery in 2020.
The on-site brief
The production department wanted to know how long each workstation on the line took per cycle, compared with the set standard time. When a cycle was abnormally slow, they wanted to look back at on-site footage of that period rather than guess the cause. This project was a pilot on 1 production line.
What we did
We installed a control unit using an NVIDIA processing board to capture cycle start and end signals, recorded video from IP cameras to a NAS (network-attached storage), and developed a web app that plots Cycle Time charts, with points that can be clicked to open the video, viewable on a tablet. The first phase received signals from a photo sensor; the second phase switched to reading signals from a PLC (machine controller) and added a Dashboard page with a line layout, TT/TCT standard time lines and CSV file export.
- PLC / Photo sensorCycle start and end signals
- Processing boardTimes Cycle Time per workstation
- IP cameras and NASRecords on-site video
- Dashboard on tabletClick the chart to open the video
Results
The first phase passed acceptance against the checklist (Exit Criteria) with the customer's representatives in May 2019. The second phase began collecting data on the live line from late September, and the project closed in October 2019. Follow-on work was a phase for the customer's factory in Cambodia, with the site survey in 2019 and delivery in 2020.
How the brief came about
The challenge in this case was to know how long each workstation on the line took per cycle and to see the cause when a cycle was abnormally slow. Cycle Time figures alone can show which cycle was slow, but not why. Without footage, the team would have to watch on site or ask employees afterwards.
The production department of this automotive parts manufacturer therefore wanted a system that links the time of each cycle to video of the same period and compares it with the set standard time. This project was a pilot on 1 production line, carried out in 2 phases in 2019.
What are Cycle Time, TT and TCT?
Cycle Time is the time one workstation takes to complete 1 cycle. TT (Takt Time) is the pace at which the line must produce to keep up with the plan. TCT is the standard time per cycle that the user sets in the system. With these three values on the same chart, you can see which workstation is running slower than target.
Requirements and constraints
The system must time every cycle at each workstation and be able to open that cycle's video from the chart. The requirements for the second phase were as follows:
- Time and display 4 workstations on 1 line, against TT and TCT standard time lines
- Read cycle start and end signals from the PLCs of the machines on the line
- 7 cameras as per the project specification: 5 workstation cameras and 2 wide-angle cameras covering the whole line, with video stored on the NAS
- View data by date and by day or night shift
- Export data as CSV files and chart images
- View results on a tablet
The main constraint is the PLC signal connection point. The system can time cycles when the PLC connection point sends usable cycle start and end data, so preparing the data from this connection point is part of the installation work.
How does this system time cycles and open video from the chart?
This system does two jobs at once: it times how long each workstation takes per cycle and records video of the same period. We chose to link the times to the video because the brief called for seeing the cause, not just the numbers. When a supervisor sees a slow cycle on the chart, they click that point to open that cycle's video.
Cycle start and end signals can come from 2 sources. In general, a photo sensor can be added at a workstation without connecting to the machine's control system, whereas a PLC provides signals directly from the machine. In this job, the first phase used a photo sensor and the second phase switched to signals from the PLC.
- 1
Receive cycle start and end signals
The control unit using an NVIDIA processing board receives signals from a photo sensor in the first phase or from the PLC in the second phase, then records the time of each cycle.
- 2
Records on-site video
IP cameras record images of the workstations and wide-angle images of the line, stored on the NAS for later playback.
- 3
Display on the Dashboard and report page
The Dashboard page shows the line layout and bar charts of the minimum, maximum and average Cycle Time for each workstation, against the TT and TCT lines. The report page (Report Graph) shows statistics for each workstation by shift.
- 4
Review footage and export data
Click a point on the chart to open the video of that period, and export CSV files and chart images for further analysis.
The report page calculates the average, maximum, minimum, number of cycles included in the calculation and standard deviation only for cycles within a range close to the set standard time (TCT). Cycles far from the TCT therefore do not skew the workstation's statistics.
What was delivered in each phase
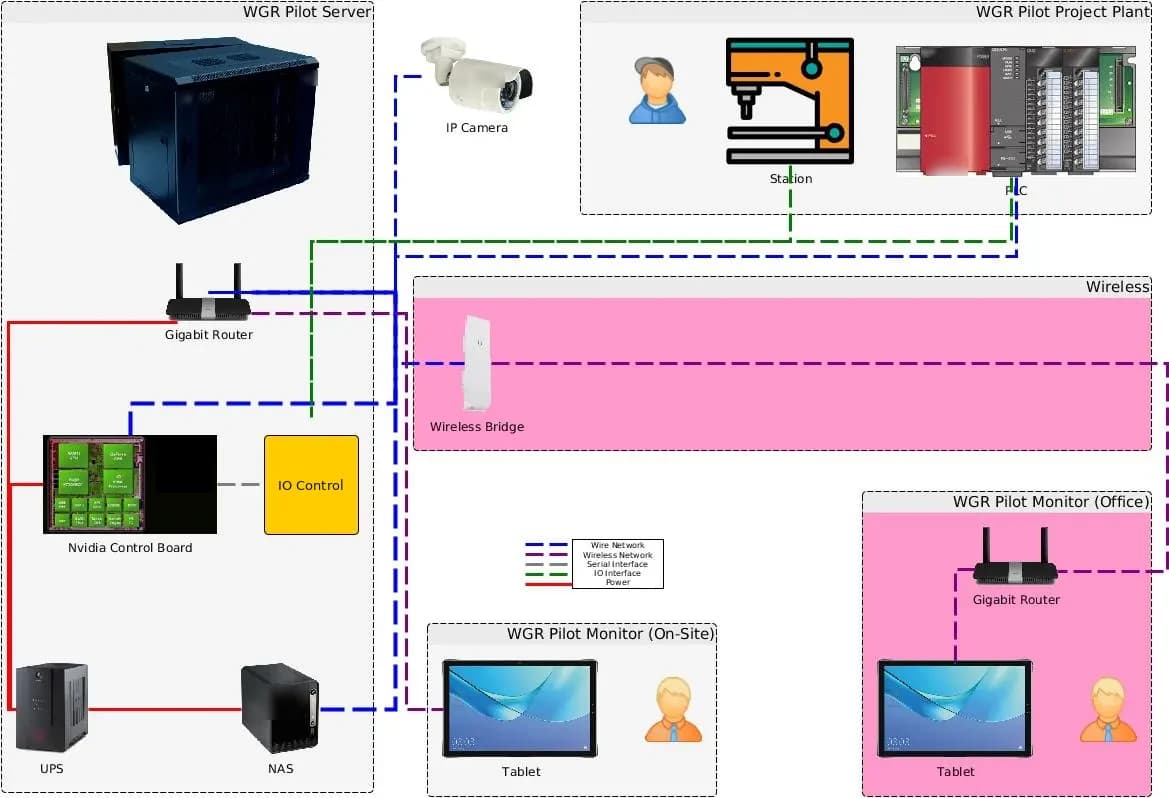
We delivered both the hardware and the software of the system. The software is a PHP + MySQL web app on Ubuntu, together with Python programs. The system layout includes the server cabinet, processing board, IO control box, IP cameras, router, wireless bridge, NAS, UPS and tablet.
What was installed and developed in each phase
| System part | First phase | Second phase |
|---|---|---|
| Cycle start and end signal | Photo sensor | Signals from the machine PLC |
| Video | IP cameras recording to NAS | Designed for 7 cameras as per the specification, with video stored on the NAS |
| Screen | Cycle Time chart with click-to-open video, viewed on a tablet | Dashboard with line layout, bar charts of minimum, maximum and average values, TT/TCT lines, and report page by shift |
How did this pilot project proceed, step by step?
This project ran in 2 phases on the same line between April and October 2019. Each phase had its own acceptance checklist (Exit Criteria). During the second phase, follow-on work for the customer's factory in Cambodia also began. The sequence of work was as follows:
- First phase: used a photo sensor, IP cameras and a Cycle Time chart web app; passed acceptance with the customer's representatives in May 2019.
- Second phase: switched to signals from the PLC and added the Dashboard page. The system began collecting data on the live line from late September, and the project closed in October 2019.
- Cambodia phase: site survey in 2019 during the second phase, with delivery in 2020.
Details of the Cambodia phase are in the case on cross-border PLC data and production line video transmission, Cambodia–Thailand.
Confirmed results from acceptance and project close-out
The first phase of the cycle timing system with video passed acceptance against the checklist (Exit Criteria) with the customer's representatives in May 2019. The second phase began collecting data on the live line from late September, and we closed the project in October 2019.
Follow-on work was a phase for the customer's factory in Cambodia, for which the site survey began during the second phase, with delivery in 2020. This case has no measured business figures, so we report only results backed by documents. The figure of 7 cameras is a number from the design specification.
What we learned
This job provides the following principles for systems that time cycles alongside video:
- The PLC signal connection point must be agreed and prepared before installation. This job showed that preparing data from the PLC connection point must be planned with the site from the outset; it is not work to be done after the equipment is installed.
- Clicking from chart to video works when the clocks of the signal capture unit and the cameras match. This job showed that a system of this kind should have a central time source, such as a real-time clock (RTC) in the control cabinet, from the start of design.
- Video takes up a lot of storage. This job showed that the video retention period and the backup plan must be defined before actual recording begins.
How can this approach be applied to your production line?
If your line has several consecutive workstations and you want to find which one is slow and why, you can use the same approach as this case: time each cycle, compare it with the standard time, and link it to video of the same period. What needs adapting is the signal source, the number of cameras and the video storage.
Reusable parts and parts that need adapting
| System part | Reusable | Needs adapting when |
|---|---|---|
| Cycle start and end signal | Signal input from a PLC or photo sensor | If your machine does not allow signals to be read from its PLC, a sensor mounting point must be chosen instead. |
| Cameras and video | Workstation cameras together with wide-angle line cameras | If your line layout and number of workstations differ from this case, a site survey is needed to determine the number of cameras. |
| Visualisation | Cycle Time chart against TT/TCT lines, with click-to-open video | If your factory uses metrics other than TT/TCT, the metrics must be agreed before the screens are designed. |
| Data storage | Video storage on NAS and CSV file export | If video must be kept for longer, the storage space and backup plan must be worked out again. |
| Network | Viewing results on a tablet in the factory | If LAN cabling or a wireless signal does not yet reach the control cabinet and the tablet locations, it must be prepared first. |
- Agree clearly with the maintenance team where the cycle start and end signals will be taken from, and test the signals before installation day.
- Choose processing hardware that supports the required number of cameras and image resolution.
- Inform employees that the cameras record work to improve the process, not to assess individuals.
- Write clear acceptance checklists (Exit Criteria) for each phase, so that acceptance and project close-out are judged on the same understanding.
Read more
- Case: cross-border PLC data and production line video transmission system, Cambodia–Thailand (follow-on phase)
- Case: multi-line production output and operating rate tracking system for an automotive parts manufacturer
- Case: Task Cam trial for assembly sequence inspection and per-step timing
- Task Cam: AI camera analysing work sequences and Cycle Time at workstations
- AI / IoT consulting and system design service
- Custom inspection and control system development service
- Article: choosing ready-made Task Cam or custom-built Machine Vision
Technology used
Frequently Asked Questions
How does the system know when each cycle starts and ends?
The system receives cycle start and end signals from devices on site. In this case, the first phase used a photo sensor and the second phase read signals directly from the machine PLC, so the system can time cycles by itself without employees pressing a button.
How many cameras are needed?
It depends on the line layout and the number of workstations. The specification for this case set 7 cameras for 1 line: 5 workstation cameras and 2 wide-angle cameras covering the whole line. For your line, we survey the site before proposing the number of cameras.
Can I view past data and analyse it further?
Yes. The system lets you view graphs by date and by day or night shift, open past video stored on the NAS, and export data as CSV files with graph images for further analysis.
Should we start with 1 line first?
Yes, because a pilot on 1 line shows what needs preparing before expanding, such as PLC signal connection points, matching time across devices and video backup. This case also started as a pilot on 1 production line.
How much does a system like this cost?
There is no standard price, because it depends on the number of workstations, the number of cameras and the PLC connection at each factory. Please contact us to request a quotation after a site survey.